Pivot points are one of the most used indicators in day trading. The tool provides a specialized plot of seven support and resistance levels intended to find intraday turning points in the market.

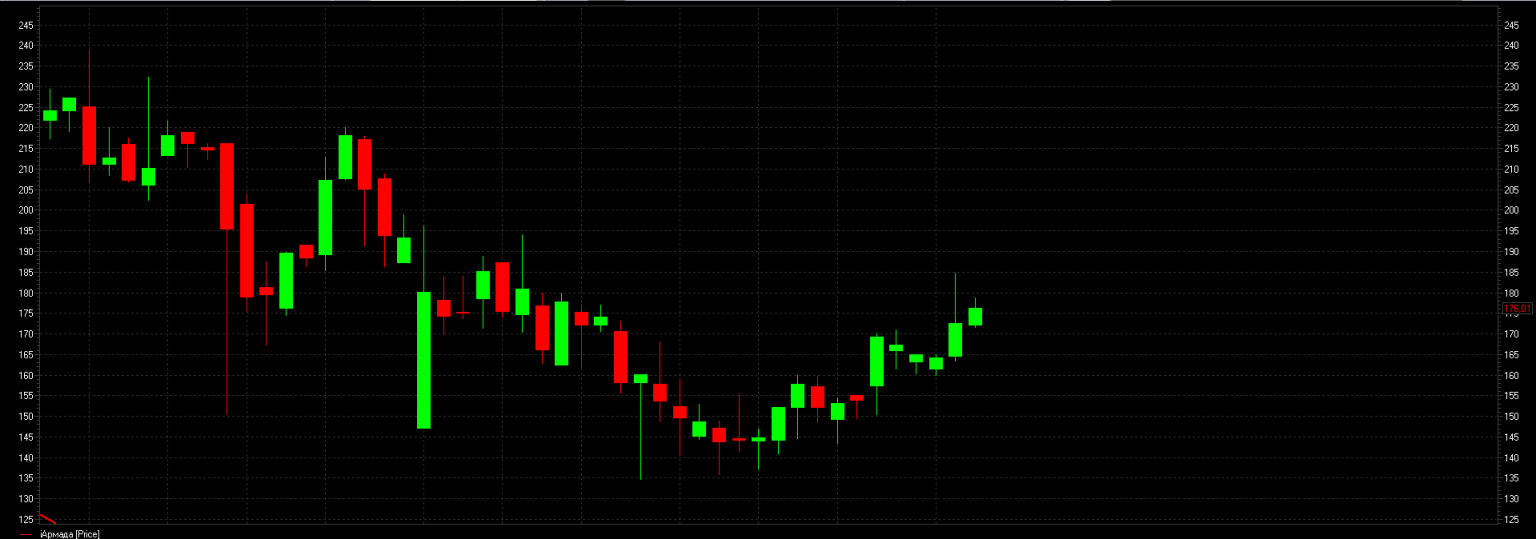
Below is an overview of how this appears on an hourly chart of the AUD/JPY currency pair. All seven levels are within sight.
While traders often find their own support and resistance levels by finding previous pivot points in the market, the pivot automatically picks daily. As many market participants follow these levels, the price reacts to them.
Calculation of pivot points
Pivot points can be calculated for different time frames in some charting software programs that allow you to customize the indicator. For example, some programs allow you to calculate pivot points for a weekly or monthly interval. But the standard indicator is at the daily level.
The central price level – the pivot – is calculated as a function of the market’s high, low and close from the previous day (or more generally). These values are summed and divided by three. This is the same concept as the ‘typical price’.
Pivot = [High (Prev) + Low (Prev) + Close (Prev)] / 3
The other six price levels – three support levels and three resistance levels – all use the value of the pivot as part of their calculations.
The three support levels are conveniently called support 1, support 2 and support 3. The three resistance levels are referred to as resistance 1, resistance 2 and resistance 3. You may also see them referred to by their shorter forms – S1, S2, S3, and R1, R2, R3, respectively. These values are calculated as follows:
- Resistance 1 = (2 x pivot) – low (previous period)
- Support 1 = (2 x pivot) – High (previous period)
- Resistance 2 = (pivot – support 1) + resistance 1
- Support 2 = pivot – (resistance 1 – support 1)
- Resistance 3 = (pivot – support 2) + resistance 2
- Support 3 = pivot – (resistance 2 – support 2)
Since the price levels are based on the high, low and close of the previous day, the greater the range between these values, the greater the distance between levels on the next trading day. Similarly, the smaller the trading area, the lower the distance between levels will be the next day.
It should be noted that not all levels will necessarily appear on a map at the same time. It simply means that the scale of the price chart is such that some levels are not included in the viewing window.
Use of hubs
Pivot points were initially used on stocks and in futures markets, although the indicator has been widely adapted for day trading in the forex market.
Pivot points have the advantage of being a leading indicator, which means traders can use the indicator to gauge potential turning points in the market ahead of time. They can either act as trading targets themselves, using them as support or resistance, or as levels for stop-losses and/or take-profit levels.
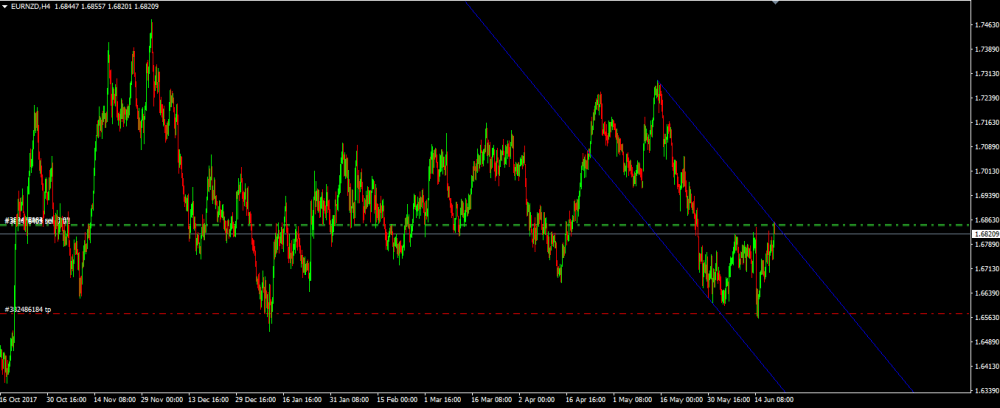
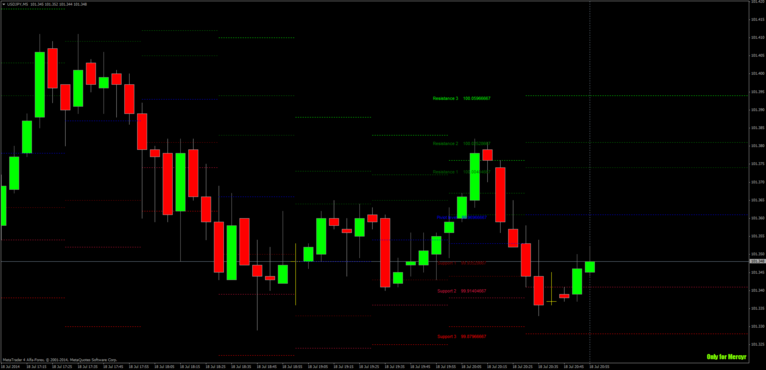
Below, for example, we can see several cases where S1 acts as support.
The pivot, which is the center line and the plane on which everything else is calculated, is the primary focus. If the price is trading above the pivot, the market sentiment for the day can be considered a positive factor (although it is still possible for a market to be lower if this is true).
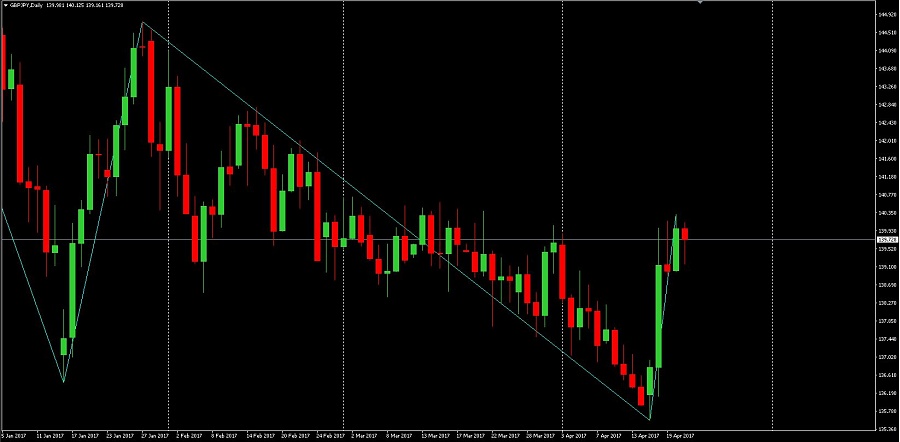
If the market is flat, the price may move around the pivot point. We can observe this type of price behavior in the chart below.
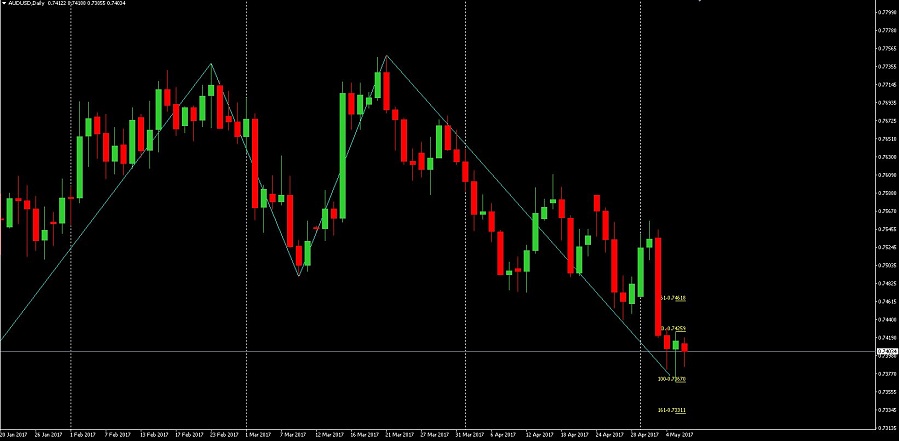
Although R1, R2 and R3 are mentioned in the sense that they are likely to act as resistance as the market rises, the price could rise above them if the price were to fall. The same applies to S1, S2 and S3, which can act as resistance on any move up if they break as support. Here, for example, we see a resistance level that acts as support.
The use of pivot points for measuring probabilities
Pivot points are also used by some traders to determine the probability of a price movement. Although dependent on the market, the following probabilities are reported in terms of the likely price to close the trading day above or below the following levels:
- Closes higher than R1 40% of the time
- Closes lower than S1 40% of the time
- Closes higher than R2 15% of the time
- Closes lower than S2 15% of the time
- Closes higher than R3 5% of the time
- Closes lower than S3 5% of the time
Of course, these are simply rough approximations. Because the price moves above or below the outer levels, it does not necessarily mean that the movements are not valid or sustainable. For example, it should never be assumed that, based on the above information, you have an 85% chance of winning a trade if you take a long position when the price hits S2. This will certainly not be true by itself.
Turn points as stop losses
Some traders take trades at a level and expect a reversal on the touch, while using the next level below it (in the case of a long trade) or above it (in the case of a short trade) as a stop loss .
For example:
Hier sien ons ‘n kort inskrywing teen R1 en ‘n keerverlies teen R2.
Trade with pivot points
At this point, it should seem pretty straightforward that pivots are used as prospective turning points in the market. It is a very common technical strategy to take trades at these levels in the direction of the expected reversal.
To improve the viability of this strategy, traders will tie the pivots strategy to other indicators. For example, a simple moving average of 50 periods can be used to measure the trend and bias one’s trades only in the direction of the trend.
Instead of taking the first touch of a pivot point, one may require a secondary touch to confirm that the level is valid as a turning point. Below is an example of why you ‘confirm’ the validity of a level before placing a basic trade. This is a five-minute chart of the EUR/USD.
If data or news arrives, the volume picks up noticeably and the previous trading movement and intraday support and resistance levels can quickly become obsolete. Indeed, on the large green bar, the price remained between the two pivot levels. But if we traded every bit of the pivots, we would have traded a long as well as a short trade within five minutes.
After the point, the market became quite strong and declined, showing no sensitivity to pivots.
So you have to be careful and make sure that you don’t try to trade the levels that the market is not going to respect when there is a lot of volume in the market.
If we were to write out our rules for this system:
1. a) If the 50 period simple moving average is positive, take only long trades.
b) If the 50 period simple moving average is negative, take only short trades.
2. Take trades on a secondary touch of the pivot after first confirming that the primary touch is a rejection of the level.
This will be applied to a 5-minute chart, but can also be applied to higher (or lower) time compressions.
For day traders using daily pivots, using the card from 5 minutes to hourly is reasonable. Swing traders can use weekly pivots to apply the strategy on the four-hour chart to the daily chart. Position traders are probably best suited to use monthly pivots on the daily or weekly chart.
But it’s a fairly simple system that can be effective.
Example
Here we have a 5-minute chart of the EUR/USD currency pair.
Die prys is in ‘n afwaartse neiging vir die dag; die prys weerspieël die S2-vlak (wat as weerstand optree), wat lei tot ‘n kort handel met ‘n sekondêre aanraking van S2.
This trade performed well after continuing the downtrend shortly after.
Now the question is of course: how do you determine where you need to get to? Before trading, you must have an exit plan. This can take several forms. Various options are shown in the diagram below.
A level of resistance forms shortly after the trade starts to move in our direction. It is, of course, reasonable to expect resistance to form again in the future.
Furthermore, if the price starts to consolidate and any momentum in the trend – or volume in the market as a whole – has faded, we can simply choose to exit the trade.
Or we can use the moving average. Some traders use some of the most popular moving averages – 50-, 100- and / or 200-period – as support and resistance levels, or consider a change in the trend if the price should rise above the moving average that is being followed.
A natural profit in a pivot system is of course also at the next level in the hierarchy. In this case, if we take a short trade on S2, our profitable level could be S3. But as mentioned above, it is generally rare to rise to the extreme levels, such as S3 and R3.
It is perfectly defensible for day traders to take trades off the table towards the end of the trading day when volume drops significantly.
A word about time zones
It should also be noted that hubs are sensitive to time zones. Most pivots are seen based on the closing prices in New York or London.
Therefore, someone using map software that uses a closing time in San Francisco or Tokyo, or in a different time zone, may have different hubs on their map that may not be tracked internationally on a large scale. This may dampen them or provide no value.
Therefore, it is recommended that you set your mapping times to either New York hours or London hours. How it relates to GMT or UTC depends specifically on where each is in the calendar, as both cities have daylight savings.
Whichever time zone you choose, know that pivots can be retested by the preceding price data. It is important to ensure that the price is sensitive to these levels in the market you are trading.
Closing
Pivot points provide a glimpse of possible future support and resistance levels in the market. This can be especially useful for traders as a leading indicator to know where the price may pivot or consolidate. It can also be used as stop-loss or take-profit levels.
Although daily pivots are most common and suitable for day traders, some platforms will also allow you to plot them for other time frames (eg weekly, monthly).
As with all indicators, it should not be used as the only thing you base your trades on. It should be used in addition to other forms of analysis and/or other technical indicators.