


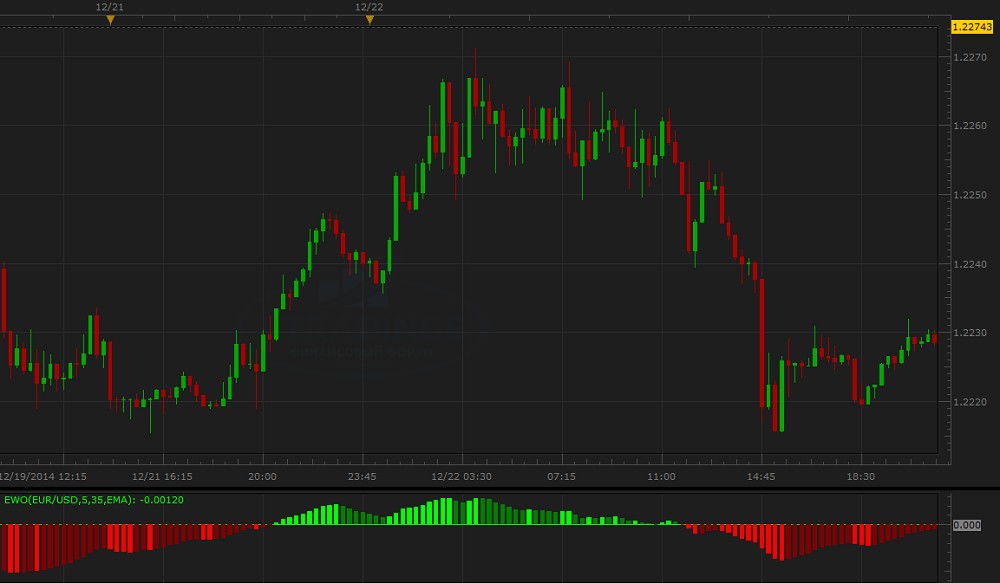
The Elliott Wave Oscillator (EWO) is the difference between a 5-period and 35-period simple moving average (SMA) based on the close of each candlestick. Formally, this can be expressed as: EWO = SMA (5-period, candle-close) – SMA (35-period, candle-close)

Uses of the Elliott Wave Oscillator
The interpretation of the EWO can be done by the individual components you tell.
A 5-month moving average is much more responsive to price than a 35-month moving average. Fewer price data points are included in the five-period. The 35-period moving average is slower to react to price, as the previous closing price is only 2.9% of the value (1/35). The five-period moving average, on the other hand, is based on 20% of the closing price of the previous candle.
So, if the price is in an uptrend and this increase was stronger than the previous five candles relative to the previous 35, then the EWO will be positive. If the price is in an uptrend but has been stronger in the last 35 candles, the EWO will be negative.
We can also trend it. Stronger trends during the past five candles relative to the past 35 will produce a negative value for the EWO. A downtrend after the last five candles that was not as strong as the last 35 candles will also produce a negative value for the EWO.
Therefore, we can interpret positive or negative EWO values in different ways:
Positive EWO value
- a) Reinforcement of tendency OR
- b) Deteriorating downward trend
Negative EWO value
- a) Reinforcement of downtrend OR
- b) Weakening upward trend
Trade Examples of the Elliott Wave Oscillator
The Elliott Wave Oscillator is essentially a trend following indicator. We can see this in two ways.
We can either look at its value – positive or negative – or we can look at the rate of change.
If the EWO is positive and increasing, this is a positive sign on two fronts. The short-term trend is bullish and the uptrend is getting stronger.
If the EWO is negative and increasing, it is doubly bearish. The short-term trend is bearish and the downtrend is getting stronger.
If we have to meet these two conditions when trading at least, it will probably increase its accuracy. A simple interpretation could be to go long if the indicator is positive and go short if the indicator is negative. However, it is not the best idea to trade based on signals that are inherently lower.
Several factors must align to confirm trading signals. This may include the use of price, support and resistance levels, various technical indicators and fundamental analysis of the market being traded. Essentially everything needed to get the trading decision right.
The EWO will produce a ton of signals on its own due to the natural frequency of 5-SMA and 35-SMA transitions. But by itself it is not a valid trading system, so strict filtering is needed. Pairing it with a longer duration moving average (eg 50 or 100 period SMA) and taking trades in the direction of the trend, as determined by that indicator, will improve reliability.
Instead of only a positive value for the EWO, we can also improve its reliability by ensuring that the value for long trades according to a specific size is sufficiently positive. For short trades we can introduce a rule where the EWO is negative by a certain amount. This helps to consolidate markets where frequent moves above and below the zero line of the indicator can give multiple weak signals.
Elliott Wave Oscillator Trading Criteria
So we’re going to see how the Elliott Wave Oscillator performed on different chart examples using the criteria below:
1) Long trade: Positive EWO value (of + X amount) + Increasing EWO value + Positively skewed 50-period simple moving average
2) Short trade: negative EWO value (of –X amount) + falling EWO value + negative skewed 50 moving average average
Exit Strategy:
1) Exit long: EWO size starts to decrease or simple moving average turns negative
2) Leave short: EWO range creatures increasing or simple moving average turning positive
In other words: to trade long, we want the EWO to be not only positive, but also always positive. The trend, as interpreted by the simple moving average, should also be positive.
To trade short, we want the EWO to be not only negative, but increasingly negative. We also want the simple moving average to be negative.
An exit would involve when one of these given signs is broken.
Example # 1
Let’s look at a daily chart of the S&P 500.
Over this nine-month time frame, we have nine trades – 7 longs and 2 shorts, as marked between the vertical white lines. It was generated when all three of our criteria were met.
This means a positive EWO value of a certain size, an increasing EWO value and a positive slope of SMA.
For shorts, this means a negative EWO value of a certain size, a falling EWO value and a negative slope of SMA.
Collectively, the seven yearnings delivered some profit, benefiting from the continued rise. The two shorts broke about the same.
Example # 2
Below we have a daily chart of the EUR/USD.
In this case we have six trades – 3 shorts and three long legs which are again marked between the vertical white lines.
Our short criteria are held during each short trade – negative EWO, EWO of -0.05 or lower (this value will vary according to the asset and time frame), the EWO is decreasing, and the 50-period moving average is trending negative.
Our long criteria – positive EWO, EWO of +0.05 or higher, increasing EWO, and positive skewed 50-moving simple moving average – are also maintained throughout.
Each of the first four were winners to some extent. The last two broke about the same.
Closing
The Elliott Wave Oscillator uses the basic concept of a moving average crossover to generate trading signals. It is essentially a trend-following momentum indicator.
Trades are designed to be taken in the direction of the indicator. Namely, this means long trades for positive EWO readings and short trades for negative EWO readings. However, it should be accompanied by other indicators and ideally other forms of analysis, as these indicators are not designed to be used on their own.
Indicators that integrate past data inherently delay price. While they can describe the recent past, they cannot necessarily shed insight into what will happen in the future. It has been more frequently used to use the EWO, and other moving average crossover indicators, to confirm trade ideas generated from the price chart.
It is not advisable to use them as signals. If the EWO’s trading ideas are indicated, they must be strictly filtered with other instruments.
We can also use the EWO on various charting timeframes, from the 1 minute time compression to the monthly (or higher if such a setting exists on your charting software).