


An often overlooked part of technical analysis called Level II market data can be very useful for traders. Level II market data shows a broader variety of market orders beyond the basic price, bid and market prices. Namely, it extends to the information available in the level I variety.
Level II data is also known as “market depth” by showing the number of shares, contracts or lots available at each price.
In addition, it is usually called the order book, as it shows a series of orders that have been placed and are waiting to be filled. Orders are filled when buyers and sellers in the market agree to trade at a given price.

Level I Market Data
Level I data includes the following:
Bid Price: the highest price a market participant is willing to buy an asset or security at.
Bid size: The amount of asset that the market participants want to buy at the bid price. This can include the number of stocks (eg Stocks), contracts (eg Futures) or lots (eg forex). Sometimes this number is divided by 100 (and sometimes another digit) to shorten the number of digits to be used.
Ask price (also known as the offer price): the lowest price a market participant is willing to sell an asset or security for.
Ask size: the amount of asset that market participants want to sell at the ask price. This may include the number of shares, contracts or lots.
Market price (sometimes last price): the price at which the last trade traded.
Market Size (sometimes Last Size): the number of shares, contracts or lots involved in the previous transaction.
Traditional technical analysis, which trades based on price action or indicators involving transformations of price and/or volume, relies on Level I data. Standard Level I data can typically be viewed within your broker.
For example, here is Level I data on Google (GOOG) stock:
It shows the bid, ask, current market price, current size (bid and ask size total about 200 shares, as indicated by the “2 × 2”)
Level II Market data (market depth / order book)
Level II data contains multiple bid and ask / offer prices. It shows what other players in the market are offering and offering at different price levels. In addition to Level I data, Level II contains what other market makers set their buy and sell levels for.
What are the market makers? These are traders with securities or assets that provide liquidity to the market by being willing to buy and sell at specific prices at all times.
For most traders, Level I data will be available to you through your broker. And often, but not always, free.
For those who depend on more in-depth data, such as what order size is located at what prices, they will need Level II data. These are often offered by brokers for a fee. It may be free, or it may not be available at all on some brokers. Level II data is generally more expensive than level I data on stock and futures platforms. This is often free with many forex brokers.
For an example of the difference between level I and level II, let’s say you are trading a stock with a market price of $25.00; the bid is $24.98 and the ask is $25.02. This is standard level I data.
Level II contains a list of bid and ask prices up and down the ladder. For example, you may see bid prices at $24.95 and $24.92 with more size than you see on the regular level I bid, and ask prices of $25.05 and $25.08. Generally, there will be about five to twenty different bid and ask prices, all from different market makers and market participants.
Below is a list of the information included in Level II data:
Multiple Bid Prices : Level II data includes the bids from Level I data as well as all other bid prices below this figure. In the most liquid markets (those most heavily traded), you’ll likely see bids for every price increase—for example, for every $0.01 in a large-cap stock. If assets or securities have large spreads over the bid/ask – that is, the difference between the bid and the ask is 0.1% or more the price of the security, then this is probably also a significant gap in the bid and asking spreads in the market depth data.
Bid sizes: The amount of asset that the market participants want to buy at the various bid prices.
Multiple ask prices: This includes the demand from the level I data and ask prices above this figure. As is the case with the bid data, ask prices will generally be relatively tight in the most liquid markets. In less traded, more illiquid markets, the bids will be placed further apart.
Ask Sizes: The amount of asset that the market participants want to buy at the various ask prices.
Example of Level II Market Data
This shows an example of Level II data for a NASDAQ stock:
The very top point of the chart shows the price of the bid (160.950) and the ask (160.960) or standard level I data.
Level II data contains the bids all the way down the left-hand column and the papers in the right-hand column.
To the left of the bid prices (column starting with 160.950) is the size or number of shares offered at that level.
The next column left is the cumulative size. It represents the total number of shares that will be offered in support of the share price before it falls to the price.
The same is done to the glutton (on the right).
The far left and right columns represent different market makers.
Many traders like the cumulative number of shares offered at each level. If there is an imbalance, it can indicate which way the market is trending in respect of a particular security or asset. Traders can also look at the size offered at the bid and ask to get a general understanding of where the market is likely to be headed.
In this particular example, more shares are being offered on the demand side (left side), indicating that buyers are in fact more powerful than sellers. Consequently, this may inform a trader of a bearish bias insofar as the level II data / order book is harnessed in the decision making process.
As for further examples, but relying only on Level I data, below we see a Ford (F) loan where the size is $80K at the bid and $3K at the ask. This means that the market is clearly leaning, or that this security
expect higher.

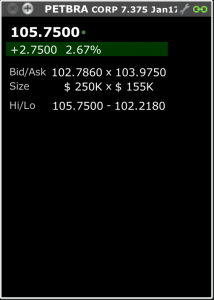
We see the same on the next Petrobras (PETBRA) bond where the size is $250K on the bid and $155K on the ask. The bid outweighing the demand is a strong market.

On Omega Healthcare Investors (OHI) stock, you can see about twice the bid. This indicates a
more clumsy slash.
Some traders will also look at any asymmetry regarding where the latest trades are taking place. If more transactions occur closer to the bid (lower price), this may indicate that the price is likely to fall. If more transactions fill closer to the demand (higher price), this may indicate that the price is likely to rise.
None of this is fool proof, of course. Orders can come in at any time to influence the direction of the market.
Closing
Level II market data, also known as “market depth” and the order book, looks at prices and sizes of bids and asks beyond the bid and ask prices closest to the market price in Level I data.
Day traders can receive both level I and level II market data via their broker. Level II data should be available for stocks and futures. However, there may be an extra charge for this. Some provide Level I and Level II data for free, but may compensate by charging higher commissions per trade.
Many forex brokers offer Level II market data, but some do not. Many only give you Tier I data and a map platform.
Level II data is usually not used in isolation as a trading strategy. Day traders will usually use it in conjunction with technical analysis strategies or along with fundamental analysis. But it can be an additional form of analysis to help better inform trade decision making.