


Volume weighted average price (VWAP) and moving volume weighted average price (moving VWAP, or sometimes MVWAP) are a type of weighted average that includes volume in their calculations. This is shown directly on a price chart.

VWAP is an indicator for day trading only – it will not appear on the daily chart or more extended time compressions (eg weekly, monthly).
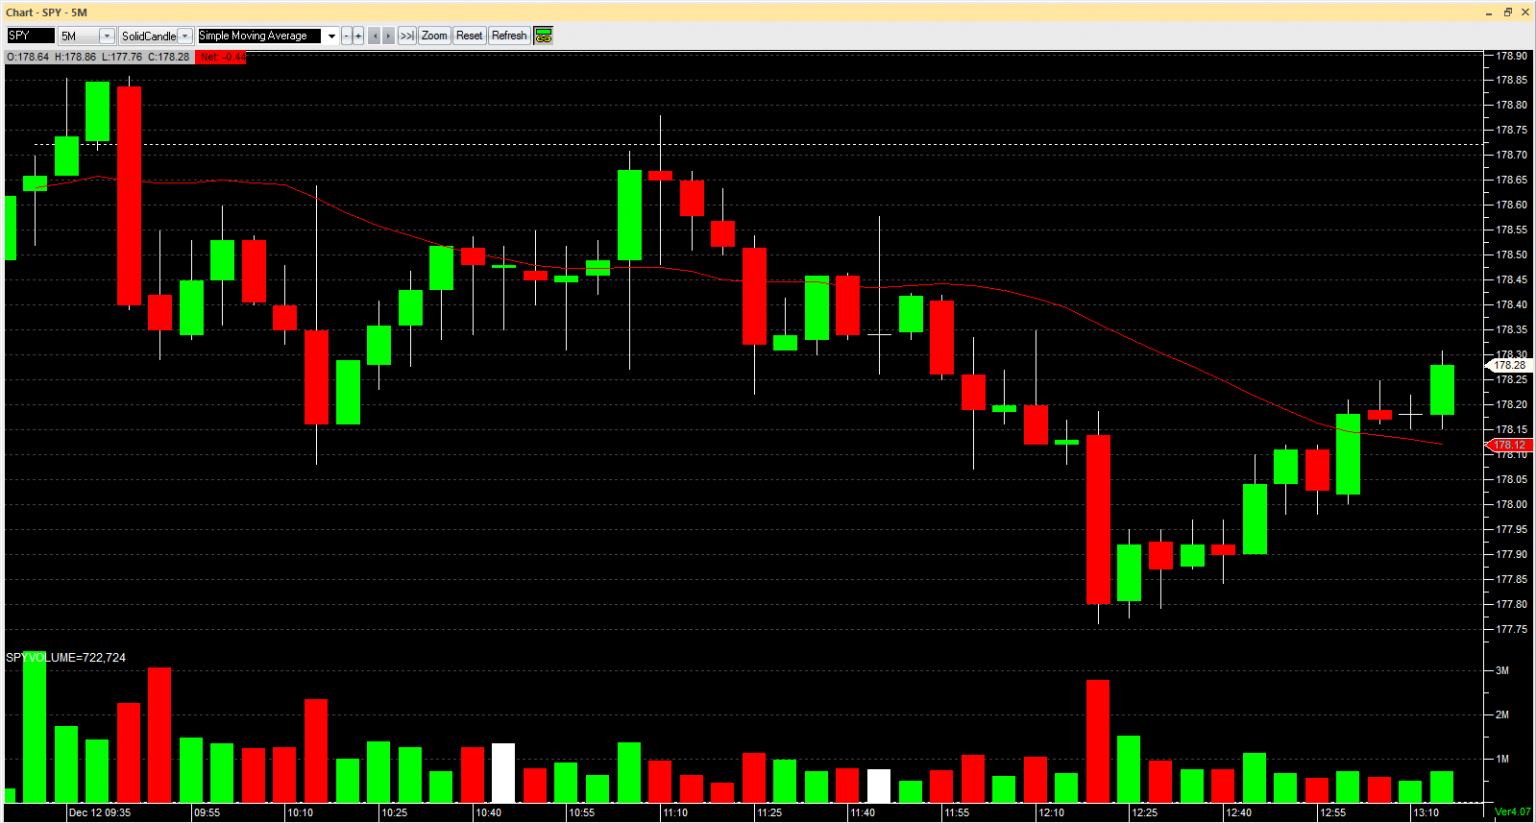
Example of VWAP applied to a 5-minute chart of the S&P 500
Prices that move below VWAP can indicate that a security is ‘cheap’ or ‘of value’ on an intraday basis. In contrast, the price above VWAP may indicate that a security is ‘expensive’ on an intraday basis.
VWAP is also used as a barometer for trade fills. Volume is an important component related to the liquidity of a market. For example, if a long trade is filled above the VWAP line, it can be considered a non-optimal trade fill.
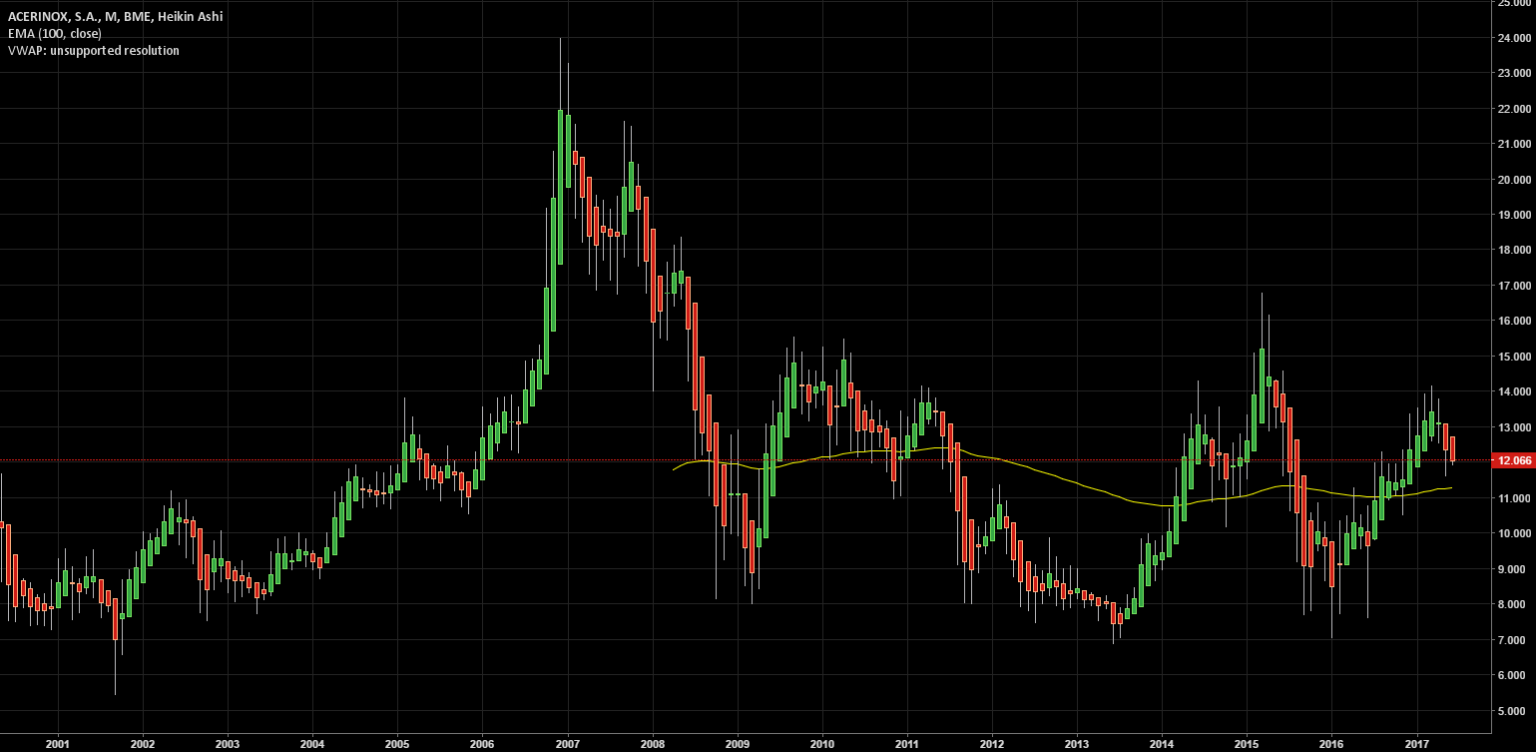
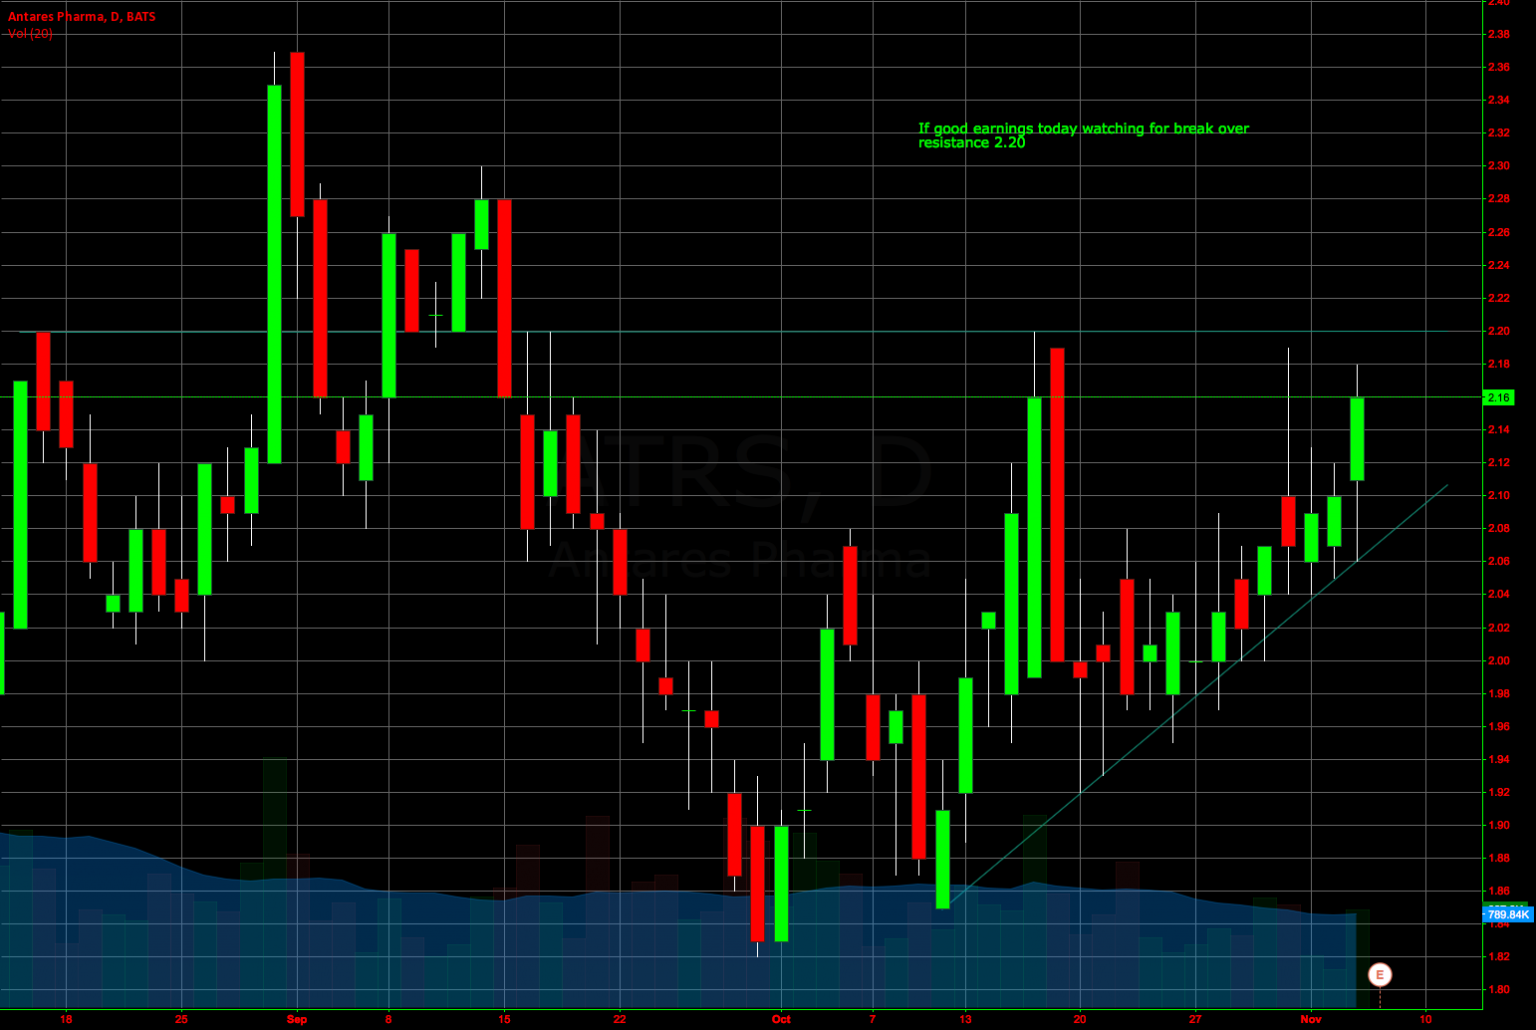
By moving the VWAP, the VWAP calculations track the passage of time and essentially form a moving average. The period can be adjusted to include as many VWAP values as possible. Below is an image of the moving VWAP plotted on a daily chart of the S&P 500 (pink line).

It should be noted that VWAP and moving VWAP may not work on currencies / forex, because many software platforms do not take into account the volume data in this asset class.
VWAP calculated
VWAP is calculated through the following steps:
1. Calculate for each period the typical price, which is equal to the sum of the high, low and close price divided by three [(H + L + C) / 3]. One bar or candlestick equals one period. Where this period is determined is at the discretion of the merchant (eg 5-minute, 30-minute, etc.).
2. Take the typical price (TP) and multiply by the volume (V) and give a value TP * V.
3. Keep a running table of the TP * V totals as well as a running count of the volume totals. It is additive and aggregated throughout the day.
4. VWAP is calculated by the formula: cumulative TP * V / cumulative volume
This calculation returns a volume-weighted average price for each data point when run on each period. This information is overlaid on the price chart and forms a line, similar to the first image in this article.
Shifting VWAP is simply adding up different VWAP figures at the end of the day and using them over a number of specific periods.
VWAP is automatically calculated in the mapping software. There may not be any mathematical or numerical variables that need to be adjusted. On the moving VWAP indicator you need to set the desired number of periods.
Uses of VWAP and Moving VWAP
VWAP, which is an intra-day indicator, is best for short-term traders who make trades that usually last only a few minutes to hours.
As a long-term moving average, the moving VWAP is more suitable for long-term traders who take trades that span days, weeks or months.
The moving VWAP is a trend following indicator and works in the same way as moving averages or moving average proxies, such as moving linear regression. For those who use trend following as the basis of their trading strategies, the move of VWAP can be a viable indicator to tap into the system.
Price reversal traders can also use moving VWAP. In such cases, it is recommended that you use a crossover strategy. The basic idea in crossover strategies is to use a ‘fast’ average to measure the direction of the trend when it is about a ‘slow’ average.
It is recommended to use shorter time periods for these averages to find price reversals in time. For example, your “fast” moving VWAP line can be set at 1-3 periods, while the slow moving VWAP line can be set at around 5-10 periods.
This ensures that the price reacts quickly enough to diagnose shifts in the trend, before the bulk of the move is already over and leaves a non-optimal entry point. How to approach this will be covered in the section below.
Trade examples
As mentioned above, there are two basic ways to trade VWAP – either trend trading or price reversal. We will start with trend trading to start.
Trend following trade examples
Like any indicator, it is not recommended to use it as the sole basis for trading. One cannot simply follow the slope of a moving average type of indicator and expect to find the odds sufficiently in favor. The following trend is the basis of the most common strategy in trading, but it still needs to be applied appropriately. This may mean taking cues from price action, chart patterns, other technical indicators and/or fundamental analysis.
This post is dedicated to technical analysis, so we will use the moving VWAP in the context of another similar themed indicator. We use the Derivative Oscillator, which runs between bullish periods and bearish periods when above and below zero respectively.
Our trading rules will be simple:
Long trades
- The movement of VWAP must be positive
- Derivative oscillator above zero
Short trades
- The shift of VWAP must be negatively sloped
- Derivative oscillator below zero
Trade exits
- One of these two criteria is invalid
Example # 1
Let’s look at an example using moving VWAP on the daily time frame of the S&P 500.
Since the moving VWAP line is slanted throughout, we are only biased on long trades. It comes on when the derivative oscillator goes above zero and is closed when it goes below zero. The trades are marked by the ‘Buy’ zones between the vertical white lines.
It produced four decent winners and one small loser.
Example #2
Here we apply this basic system to an ETF that tracks the coffee futures market (ticker NYSEARCA: JO ).
We have one long trade and four short trades.
It has a more mixed performance, producing one winner, one loser and three that looked roughly equal.
Examples for reversing prices
Price reversal trades are completed using a moving VWAP crossover strategy. The longer the period, the more old data will be wrapped in the indicator. We want to limit this to a minimum in order to get refunds as soon as possible, therefore we want to shorten the period.
We want the periods to be short, but not so short that we end up with something that is very sparse and sends out multiple false or ambiguous signals. In the case of moving VWAP, we can lower the period of the ‘fast’ line down to 1, if necessary. Our “slow” line can be as short as five periods.
To get an indication of when the price may extend, we can pair it with another price reversal indicator, such as the envelope channel. This indicator, as detailed in more depth in this article, diagnoses when the price may be stretched. To keep the signals as accurate as possible, we use a stricter period (10) and we use a standard deviation of 5. It is unusual for price to violate the upper or lower band with these strict settings, which theoretically improves their reliability.
So to outline our rules for this system:
Long trades
- Fast (1-period) line crosses above the slow (5-period) line
- Recent touch of the lower band
Short trades
- Fast line crosses below slow line
- Recent touch of the top group
Trade exits
- Subsequent crossover of the moving VWAP lines to confirm the previous trend
Example
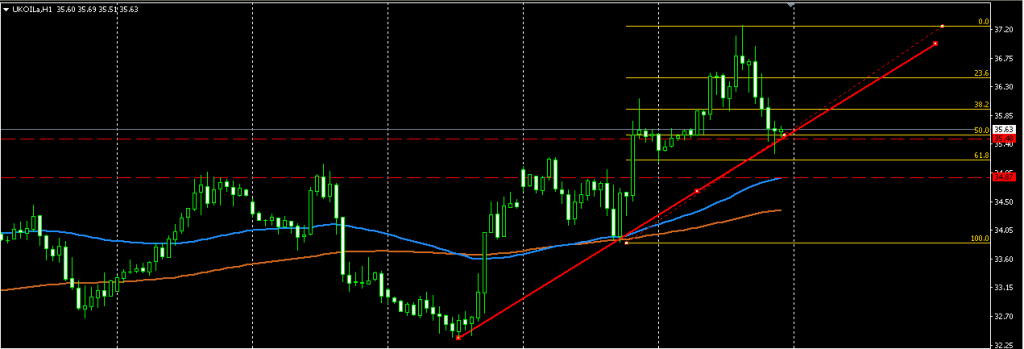
Let’s apply this to the daily chart of the crude oil market.
In the chart below, just before the first trade setup, we see a momentum burst that causes the price to hit the upper band of the envelope channel. Once the moving VWAP lines have crossed to indicate a bearish pattern, a short trade setup appears at this point (red arrow). This takes us down about 2%-3% before the ‘fast’ moving VWAP line crosses over again to confirm the trend. This leads to a trade exit (white arrow).

Later we see the same situation. Price moves up and runs through the upper band of the envelope channel. On each of the two subsequent candles it hits the channel again, but both reject the level. Once the fast-moving VWAP line crosses below the sluggish line, it is a signal to take a short against the trend (red arrow). The lines crossed five candles later where the trade was exited (white arrow). If trades were opened and closed at the open and close of each candle, the trade would have been roughly even.
Trade with VWAP
VWAP is only calculated intraday and is mainly used in the markets to determine the quality of a price fill or a good value based on the daily time frame. If the price is lower than the VWAP, it can be considered a good price. If the price is higher than VWAP, it can be considered a good price to sell.
Looking at this example of a 5-minute chart on Apple (AAPL), the price below VWAP indicates that Apple could be a fair value (or a long trade at one of these prices as a quality fill).
As the price rises above VWAP, it can inform a trader that Apple is expensive on an intraday basis. If he or she intends to go long / buy the stock with the plan of holding it only in the short term, it is best to wait.
It is clear that VWAP is not an intra-day indicator that should be traded alone. But it is a tool that can be included in an indicator set to better inform trading decisions.
Closing
VWAP is calculated throughout the trading day and can be useful in determining whether an asset is cheap or expensive on an intraday basis. Traders may check VWAP at the end of the day to determine the quality of their execution if they take a position on the particular security. If their fill price was below VWAP, that would be considered a plus (if the trade is a buy/long position). If the price is higher than the VWAP, it will be considered negative.
VWAP restarts every trading day.
The movement of VWAP is a trailing indicator. It combines the VWAP of different days and can be adjusted to meet the needs of a particular trader. VWAPs with a longer period are mostly used by long-term traders to track multi-year or multi-year trends. This can ignite ‘noise’ in a market for traders who are more concerned with the long-term trends or cycles that may exist in certain markets, rather than concentrating on the daily movement.
Price reversal traders can use switching to move VWAPs to determine turning points in a market. Moving VWAP is therefore very versatile and is very similar to the concept of a moving average.