


In this trading guide, you will learn how to trade the descending triangle pattern like a seasoned professional. In the technical world of trading, there are many different patterns that you need to be aware of, allowing you to make more informed trading decisions. Once you master the descending triangle chart pattern, a simple chart pattern, you will gain a clear understanding of what is going on behind the price action.
This simple chart pattern can be seen on long-term charts and short-term charts. It doesn’t matter what your trading style is; whether you are a swing trader or a day trader. Anyone can use the descending triangle for technical analysis to find profitable trading opportunities. In this article we are going to explain the requirements of the descending triangle and how to detect it in real-time.
We are also going to cover the psychology behind the descending triangle reversal.

Descending Triangle Pattern
The descending triangle pattern is a continuation chart pattern that develops in the middle of a downtrend. However, in some cases it can play out as a descending triangle reversal. Also known as the bullish descending triangle pattern.
The descending triangle stock pattern is a versatile chart pattern that is considered a continuation pattern and a reversal pattern at the same time.
The reverse version of the descending triangle is the ascending triangle pattern we talked about at length.
The main characteristics of the descending triangle pattern are:
- A flat support line.
- A descending trend line connecting a series of lower highs.
- The flat support line and the descending trend line converge to a point.
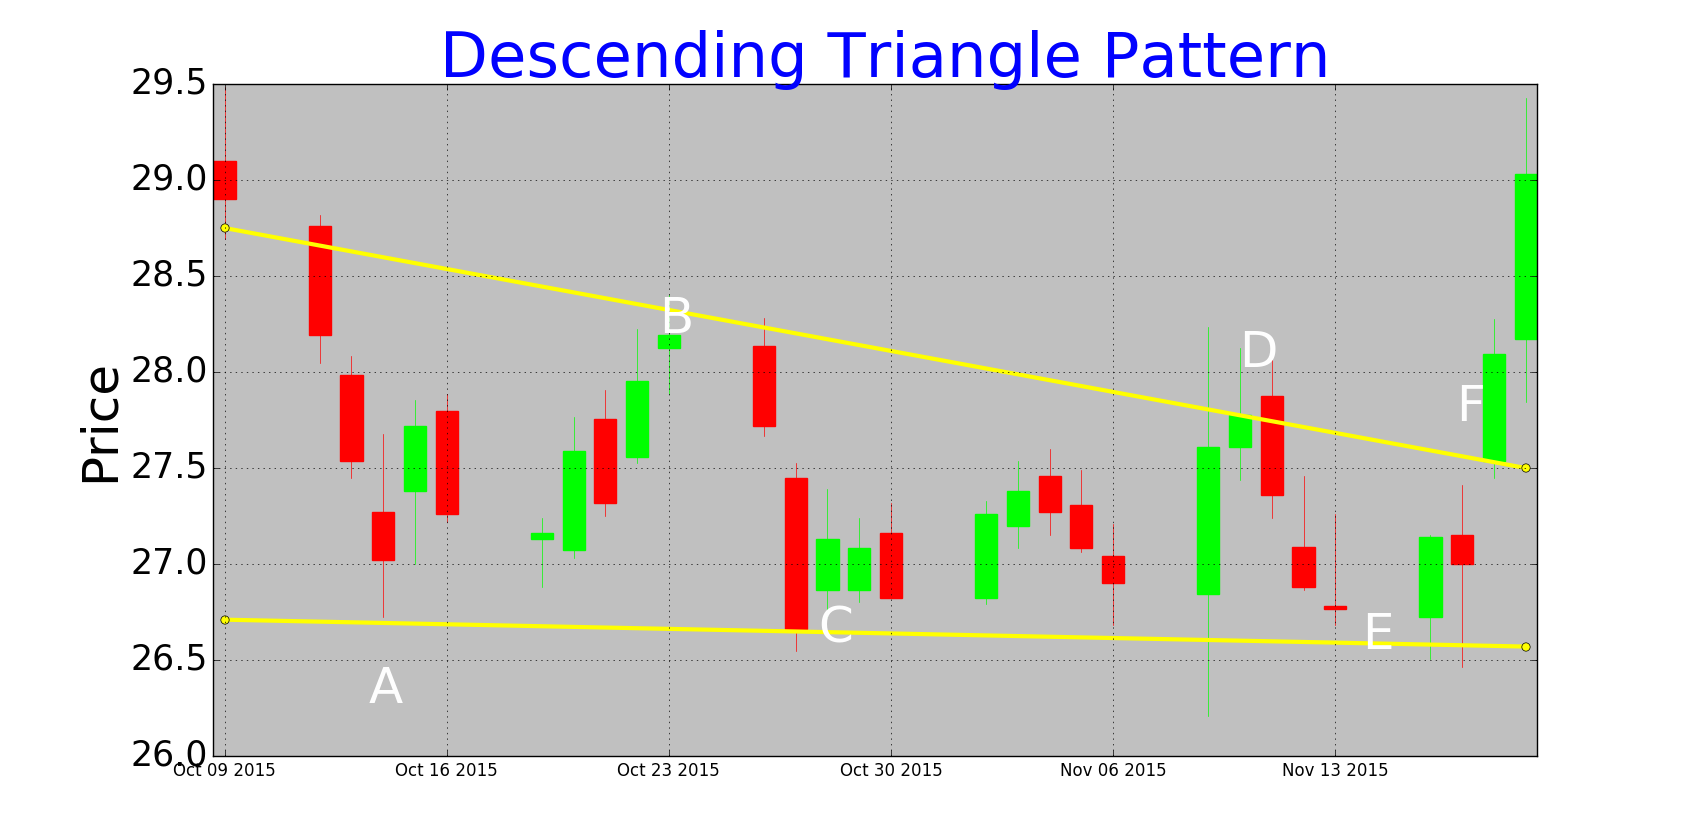
Imagine that at the top of the descending triangle chart pattern there is a downtrend consisting of a series of lower highs connected by a downward sloping trend line. At the bottom there is a solid floor of support that is tested at least 3-4 times. The support level is the lowest point from which the price cannot push lower.
Below is the ideal consecutive triangle chart setup:
As we said before, this chart pattern works on a one minute chart, five minute chart, up to higher time frames. Whether you’re scalping or swinging, you can use it with multiple assets. This includes individual stocks, global indices, commodities, Forex or cryptocurrency.
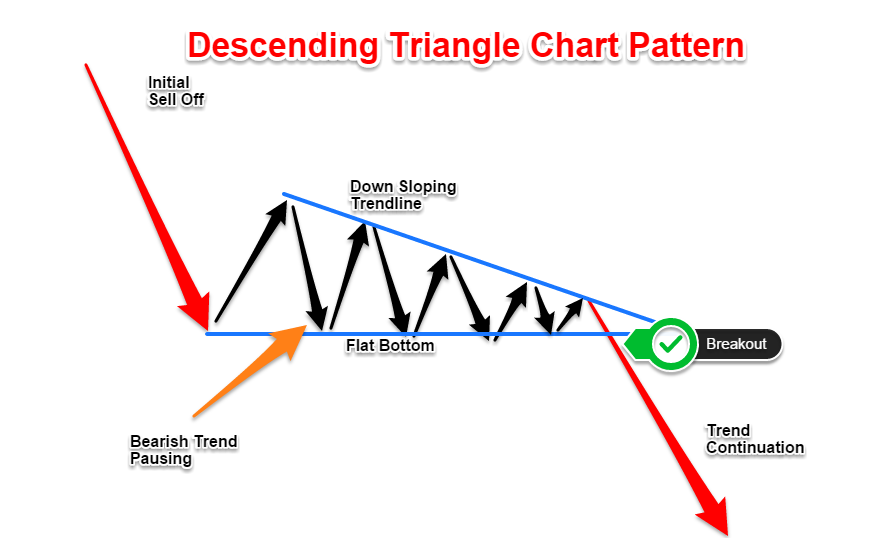
The psychology behind this pattern can be explained by the imbalances between supply and demand. You can see the descending triangle of the technical analysis as a pause of the trend. It is easy to understand how demand is drained during the development of the descending triangle. This compression to the downside is what makes the pattern bullish.
Remember: all continuation patterns, such as the bullish flag, the rectangle pattern and others that you can find on our trading strategies website, must have the context of a trend.
Check out the chart below:

In the next section of this trading guide, you will learn how to trade the descending triangle. Let’s see if we can get some trading ideas from the descending triangle breakout.
Descending triangle reversal
Let us first study the case of the descending triangle reversal. Typically, the descending triangle is more powerful when traded in the context of a trend.
It is also more powerful when traded in the direction of the prevailing trend. However, the descending triangle reversal pattern can reward you with bigger profits if traded in the right context.
We only trade the descending triangle reversal pattern when this price formation develops at the end of a bullish trend and in the context of an uptrend.
The pattern of the reversal chart appears as the buying activity declines and the market fails to make new new highs.
This shows that the imbalance between supply and demand changes in favor of the sellers as buyers become exhausted. In this case we are going to look for the flat bottom to be conquered by the bears.
The potential support breakout could reverse a powerful trend. Let’s look at an example of a day trading opportunity to effect a reversal using the descending triangle on an intraday time frame.
Check out the Forex GBP/USD chart below:
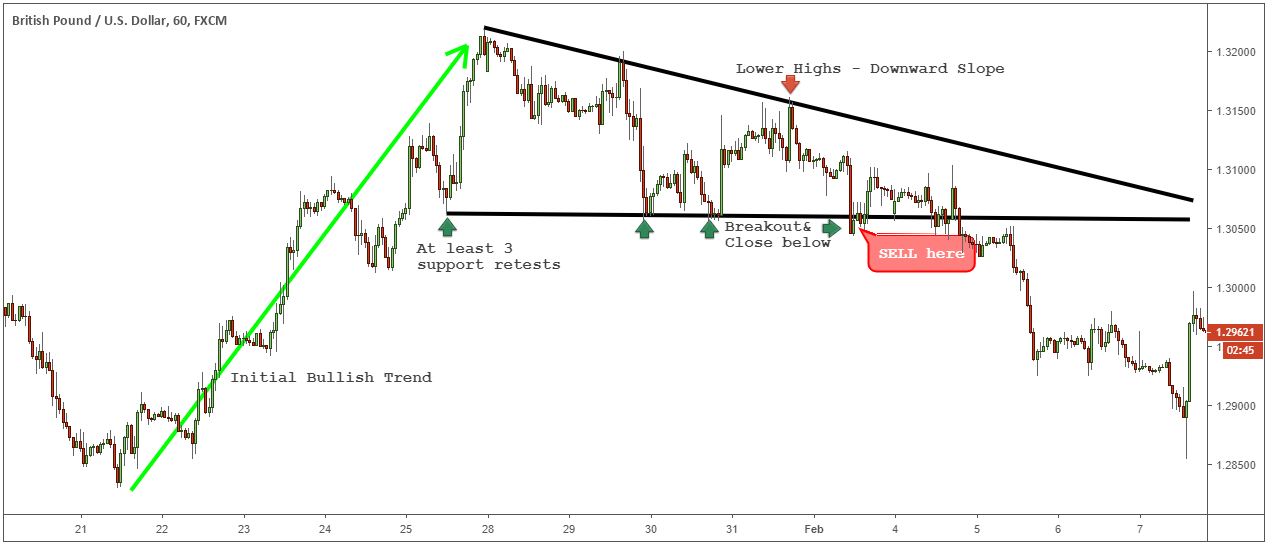
When trading the descending triangle pattern, we are always looking for the support chance to give us a potential entry point. Unlike in the textbook which says that retail traders learn that a support or resistance level becomes stronger when we have multiple tests; in contrast, the reverse is true.
Note: The more a support level is tested, the weaker it becomes.
In addition, the breakout candle must also produce a close below the flat support level for a valid trade setup.
But that’s not all.
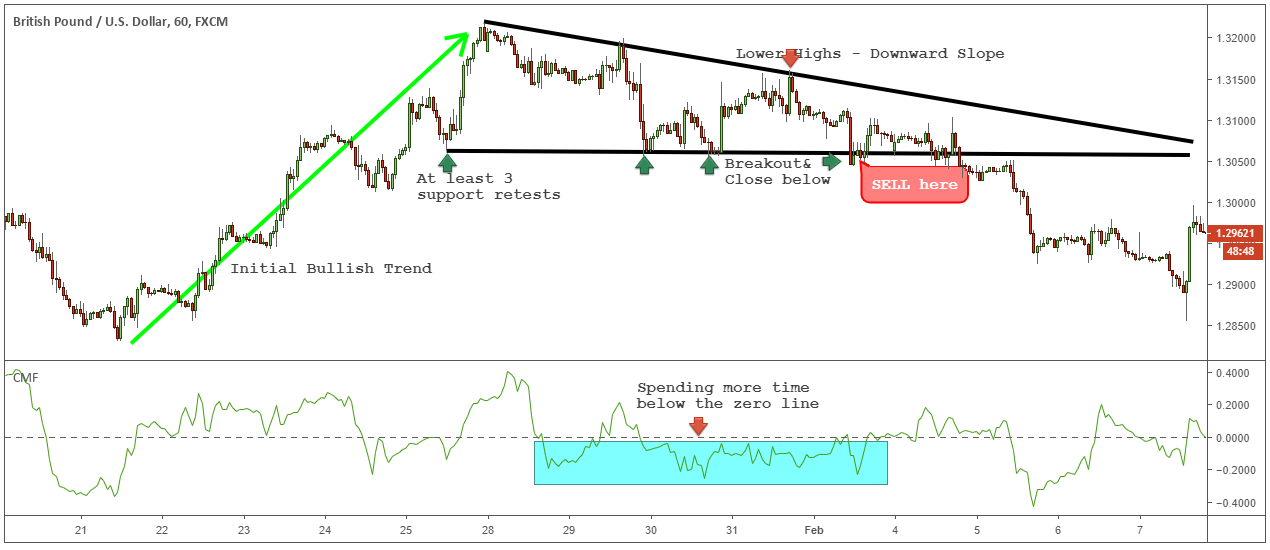
We need to take it one step further and confirm the breakdown using the Chaikin Money Flow indicator to confirm the imbalance between supply and demand. The readings we get from the Chaikin Money Flow will tell us whether the sellers have entered or not.
You only need to see if the Chaikin Money Flow line spent more time below the zero line during the time the descending triangle formed. A reading below the zero line indicates selling pressure.
See intraday chart below:
For our exit strategy we are going to use one of our favorite trading techniques. Instead of focusing on a static and random profit target, we are going to use the dynamics of the price action to achieve more accurate profit targets. To reach the profit target, simply measure the depth of the triangle. Just count how many seeds there are from the flat support line to the highest point of the triangle.
Once you’ve taken the measurement, project it from the flat support level to the downside.
Check out the chart below:
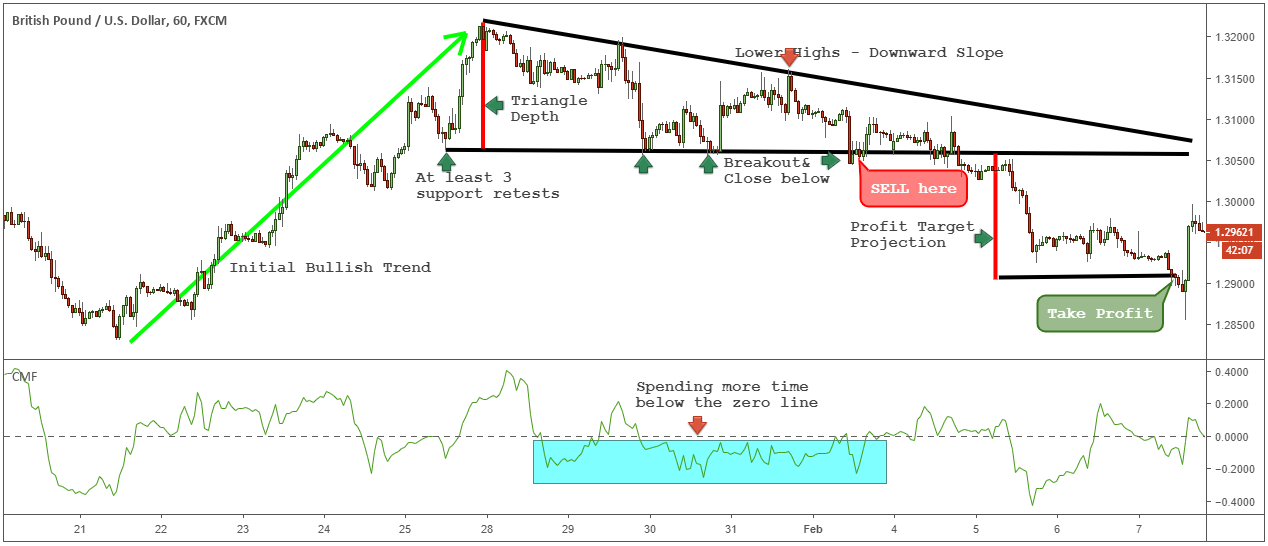
You can see how the projected triangle depth measurement becomes a very accurate profit target. This is a powerful exit strategy that can maximize your profits.
Now let’s stop for a second and look at how to properly trade the descending triangle as a continuation pattern.
Descending triangle trading strategy
It is important to remember that the descending triangle chart is traditionally used to anticipate possible breakouts in the direction of the bearish trend. In the following example, we are going to combine the descending triangle with the power of technical indicators.
Using the Chaikin Money Flow indicator together with the descending triangle breakout creates a very powerful trading strategy. One of the most important features, unique to the Chaikin Money Flow indicator, is the ability to measure the buying and selling power.
Most retailers struggle to determine the supply and demand in the market. You can solve this battle by switching to the Chaikin money stream.
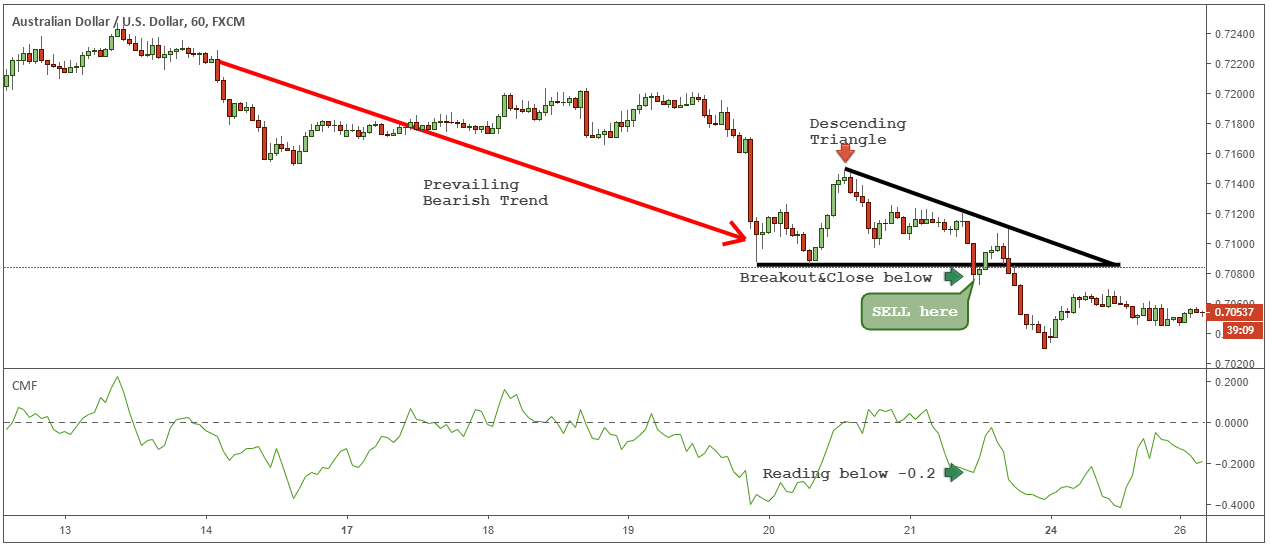
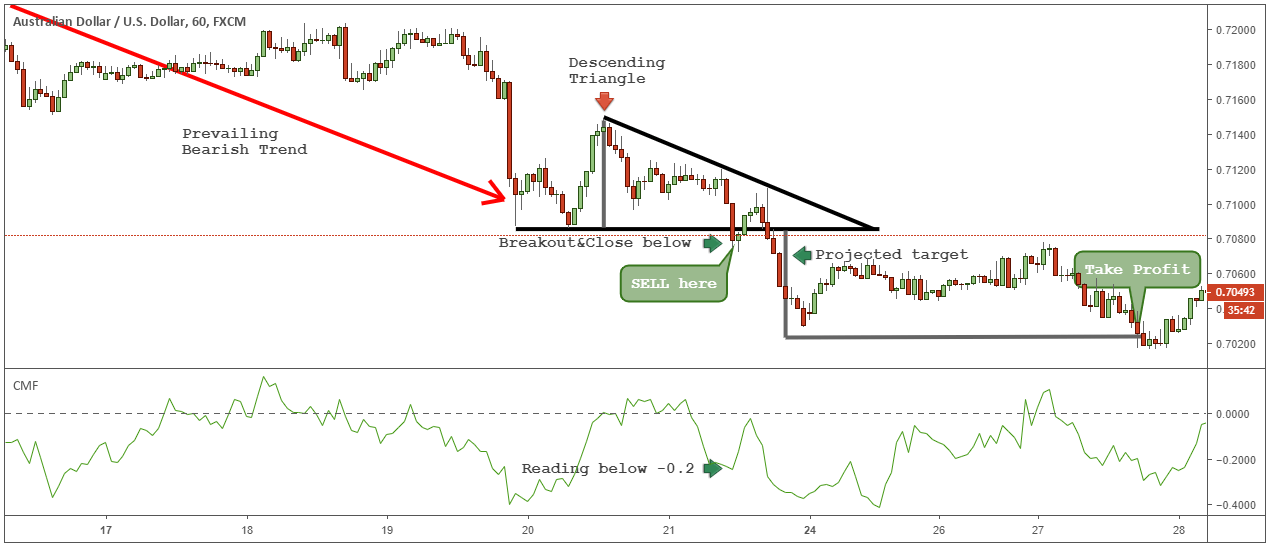
In this strategy, traders simply need to see a match between the support breakout and the Chaikin Money Flow reading. Once the descending triangle split occurs, we should have a Chaikin Money Flow reading below the -0.2 level.
The profit target calculation is based on the same exit strategy we used before. Measure the triangle depth and project the same price distance from the flat bottom.
Conclusion – descending triangle chart pattern
Trading involves risk and hard work. Make sure you are familiar with the descending triangle pattern first before making any money with this chart pattern. Stop looking for the Holy Grail and learn how to trade like the pros do. Use these simple trading tricks that are very powerful when used in the right context.
Read the latest article on Technical Analysis Strategies. The descending triangle chart pattern can be combined with your preferred trading strategy. Once you learn to identify them and train your eyes to see them in real time, it will help you better understand the price action. The imbalance in supply and demand within the descending triangle reversal will almost always produce fast and furious explosions.
Also, be sure to learn more about the strategy for trading symmetrical triangles.
Thanks for reading!