


In this article you will find how to use Bollinger Bands in day trading. This strategy uses two of the most popular trading indicators on the market, Bollinger Bands and RSI. It is used to simply find a price bounce that occurs during the most important trend.
If you are looking for Bstringer trading strategies that work, you will want to pay special attention.

This special strategy teaches you how to read Bollinger Bands and Bollinger Band signals. You also learn about Bollinger Bands squeeze, double Bollinger bands strategy, Bollinger Bands secrets, and more. We also have training for the ADX indicator.
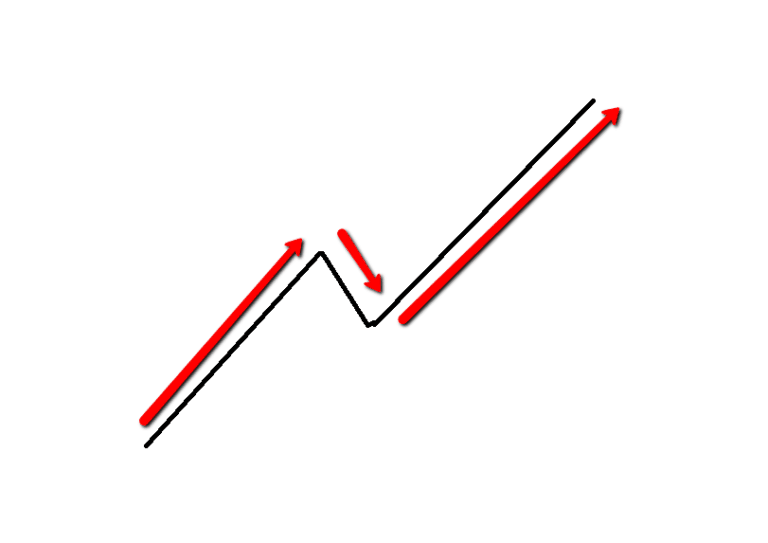
Something that will look like this:
How to use the Bollinger Bands indicator
Bollinger Bands are well known in the trading community. You can get a great Bollinger band formula with a simple trading strategy.
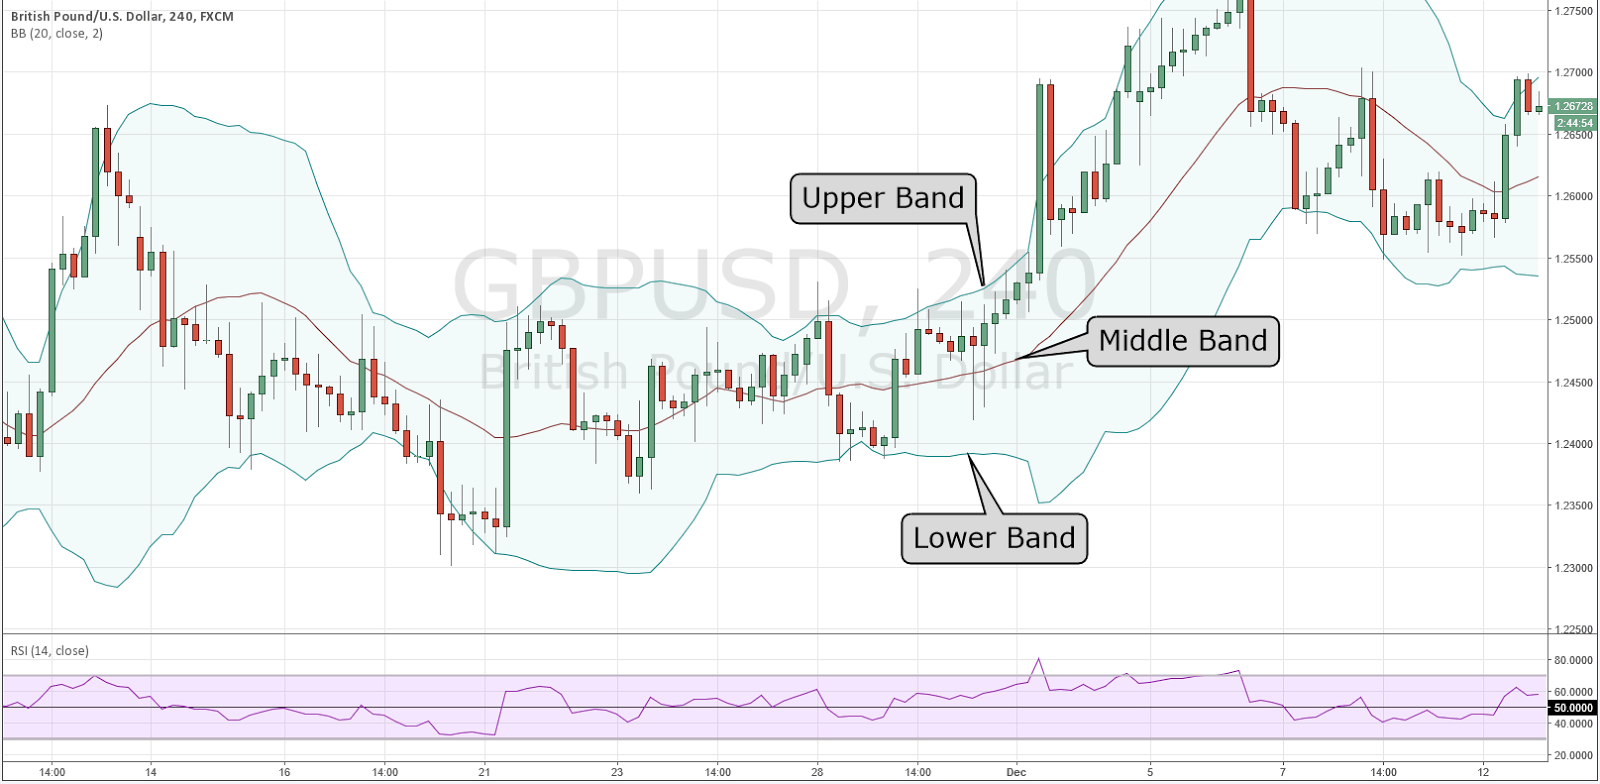
They were created in the early 1980s by John Bollinger. The purpose of these bands is to give you a relative definition of high and low. In theory, the prices are therefore high at the upper band and then low at the lower band. Bollinger Bands contain three different lines. The top, middle and bottom band. The middle band basically serves as a base for both the upper and lower.
It is mainly used to determine whether there has been overbought or oversold. Sell when the price touches the upper band and buy when the price touches the lower band.
The distance between the lower, upper and middle band is determined by volatility. The middle band consists of a 20-period moving average. The top and bottom are two standard deviations below and above the moving average in the middle. Standard deviation is a statistical measure that provides a good reflection of the price volatility.
If you see the band widening, it simply means that there is volatility at the time. If the price moves very little, the band will narrow, meaning there is little volatility.
I prefer to use this trading strategy using the 1 hour or 4 hour time chart. You can customize according to the style of trader you are. But the example I will show you will use the 4 hour and 1 hour time chart.
Let’s look at the Bollinger Bands first before looking at the rules of the strategy. Let’s see how it will look on a chart if you have never used this type of indicator in the past:
After examining the picture, it may seem prudent to buy every time the price hits the lower band. Or, on the other hand, sell every time the price hits the upper band. This may technically work, but is a risky way to trade the Bollinger Bands. Sometimes strong trends will use these bands and stop many unhappy traders who used the method. Therefore, we use the RSI indicator to confirm the bounce of an upper or a lower band and trade. Also read how bankers trade in the forex market.
The RSI indicator is used in this strategy to see how the currency weakens or strengthens. (Click here for another RSI trading strategy article).
These indicators should be standard on your trading platform. You don’t need to adjust it as we will use the default settings. Here you can learn how to fade the momentum in Forex Trading.
I would suggest drawing a horizontal line at the 50.00 level in the RSI indicator before starting. You will find out exactly why soon.
Trading Indicators Used with the Bollinger Bands Bounce Trading Strategy:
- Bollinger Bands (20, 2)
- RSI (Relative Strength Index) indicator (14)
How to buy low and sell high
In theory, Bollinger Bands will contain all trading activity that occurs within 2 standard deviations of the expected norm (the trendline).
This means that approximately 90-95% of the price movements will occur within this range.
Bollinger Band traders are looking for instances of resistance and support. Support occurs when demand becomes “concentrated” and a downtrend is likely to lose momentum. On the other hand, instances of resistance occur when an uptrend is ‘condensed’ and is likely to reverse downwards in the near future.
Bollinger Bands make it easy to buy low and sell high. Traders will open a position when the trend line approaches the bottom of the Bollinger Band range. Traders will need to close a position when the trend line reaches the top of the range.
Rules for Bollinger Band Bounce Trading Strategy
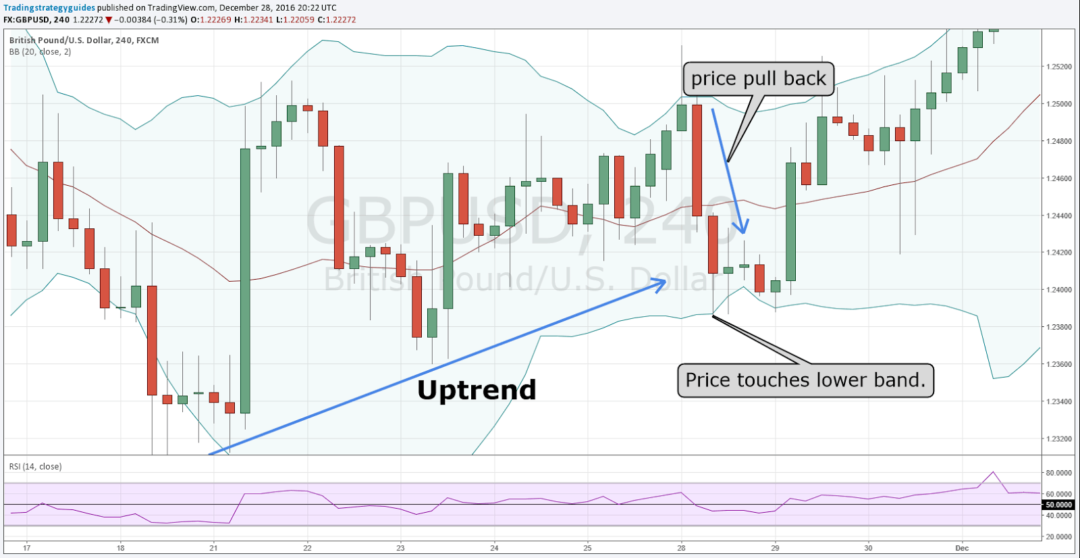
* To keep it simple, I’m going to use the same example (GBPUSD 4-hour chart) for each of these rules. This trade would have been a ‘BUY’ trade. The rules are the same concept, just the exact opposite for a SELL trade. The currency is in an upward trend and then it will pull back to the lower Bollinger Band. From there, if it follows the rules, we will execute a trade.
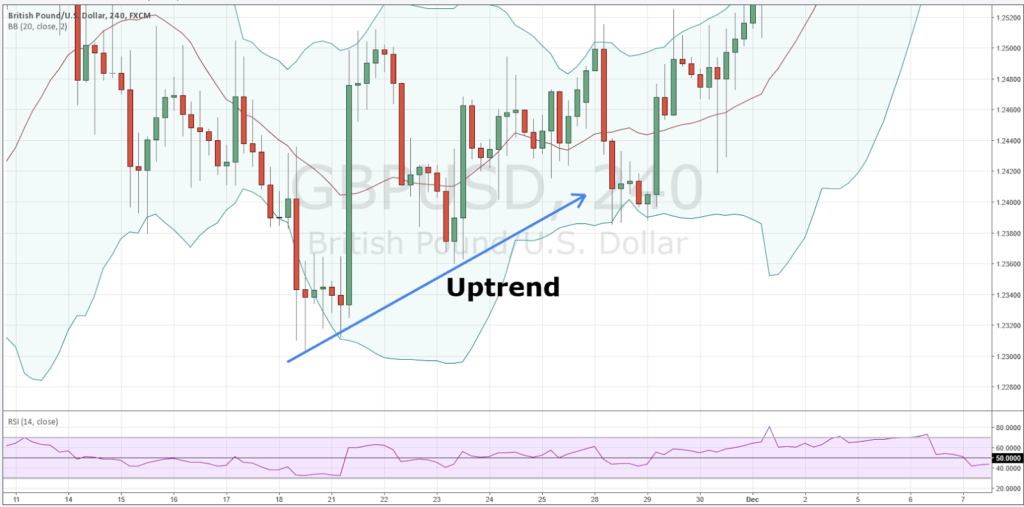
Rule 1: Find a currency that is in an up/down trend.
Finding a trending market is very simple. You can use price channels, trend lines, Fibonacci lines to determine a trend. Find higher highs or lows and place a trendline on them. If the line goes up, it is an uptrend, if it goes down, it is a downtrend. It should trend upwards or downwards, not a sideways trend.
Rule 2: the currency must fall back (from the uptrend) and the lower band must touch, or almost touch.
If I say, “Almost touching”, an example would be like this
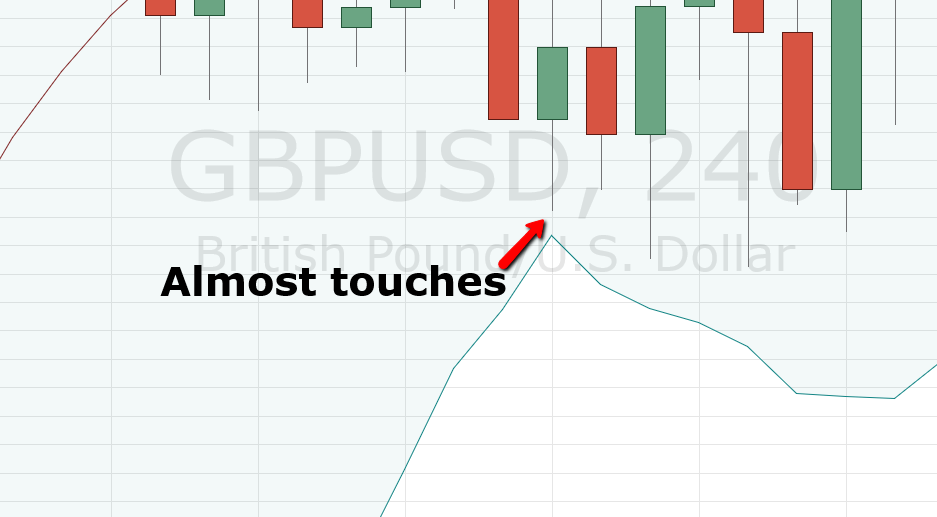
** Tips for Bollinger Band Trading: if it is more than 5 pips away from you, I would not consider it validated and I would wait for it to get closer to the lower / upper band.
As you can see in the example that the price came down from the trend, and touched the lower band.
Once the price touches the lower or upper band, look at the RSI indicator for confirmation.
Rule 3: Once the price hits the lower Bollinger Band, look at the RSI indicator and it should be between 30-50 and rising.
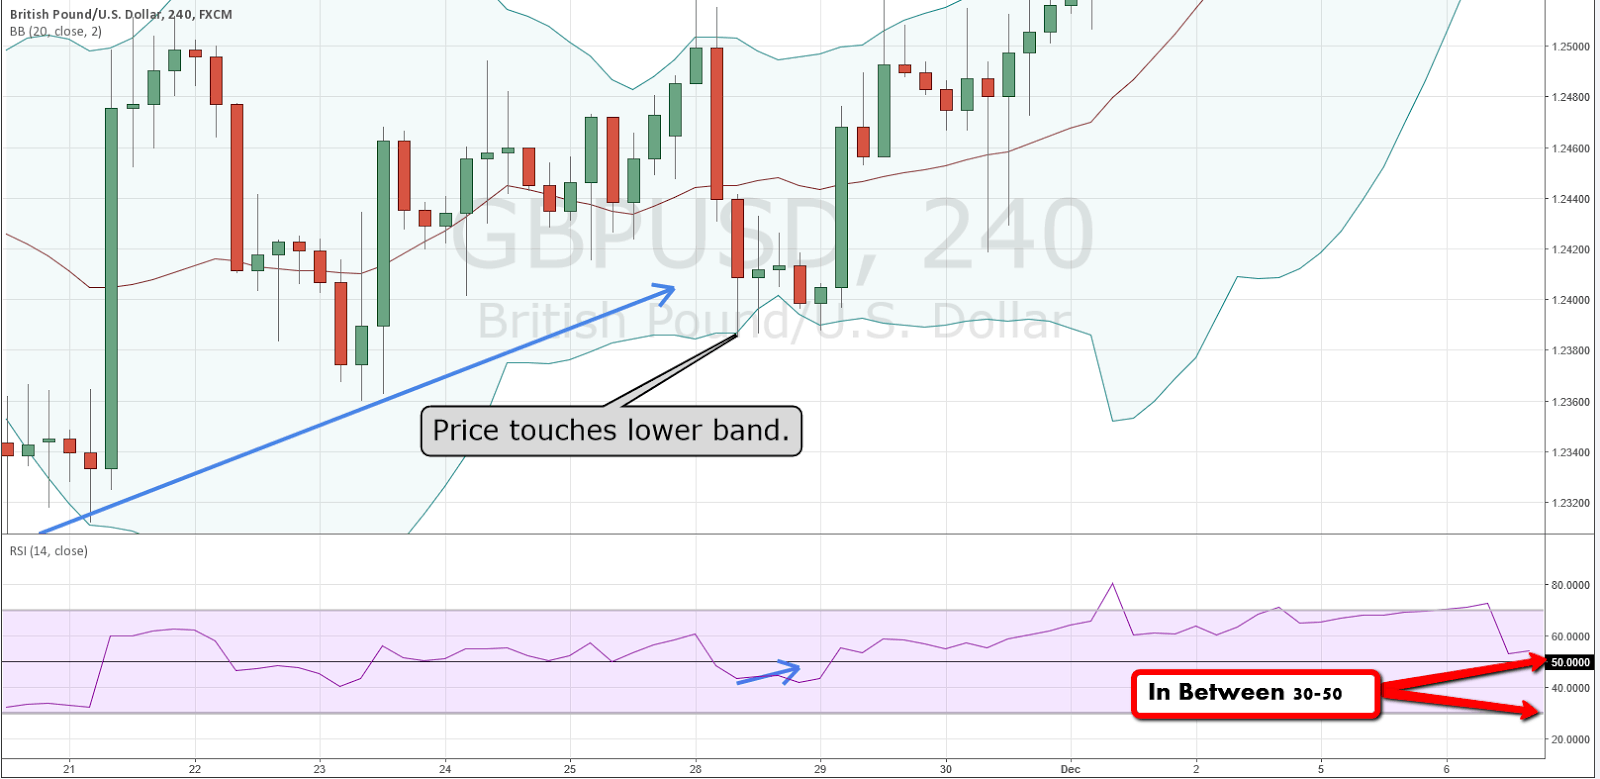
The price hits the Bollinger Band, the RSI (if the price hits the lower band) should be between 50 and 30. If it’s not here, and let’s just say it’s at the 80 mark, then you wouldn’t be interested in the trade.
You want to see the RSI rise in the direction of the trade in this case. Remember that it should be between the 30-50 mark. (In a sell price, the RSI should be between the 50-70 mark and going downwards.)
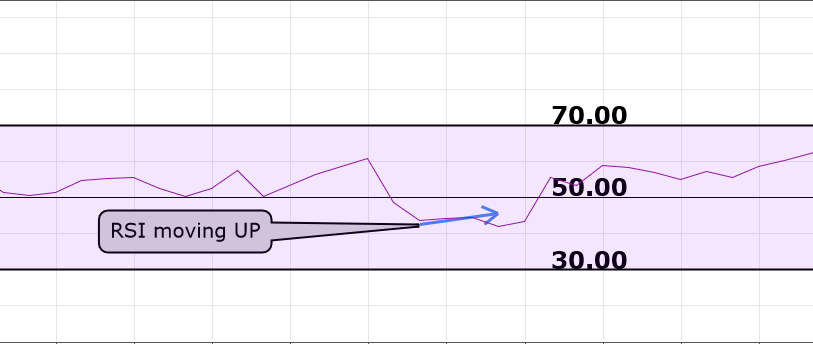
Once you see this movement, go ahead and search for an entry.
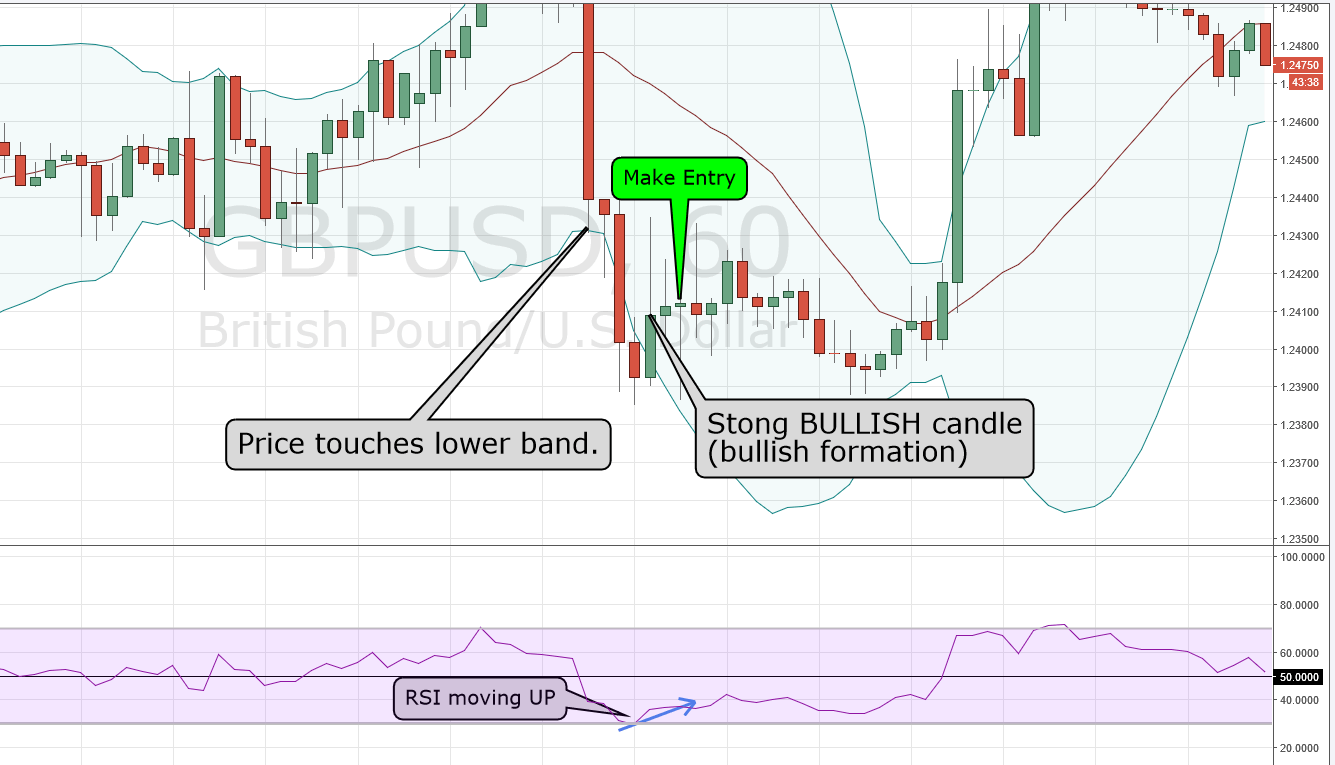
Rule 4: After price hits the lower Bollinger Band and RSI goes up, make an entry when…
You can make an entry if you see a STRONG BULL candle at the top, consecutive reversal candles to the top, or if you form a bearish pattern. You need to see the trend moving upwards in this case before entering into a trade.
If the candlesticks move to a new point, it would not be a good time to enter a trade. However, once the candles fail to make a new low watch to see if it forms a bullish formation. Here is an example of a main candlestick setup.
In this example I settled on a one hour chart to make an entry. It’s perfectly fine to do. This can give you a more accurate location to make an entry point. As I said, the 4 hour and 1 minute time frames are the preferred time frame for this strategy. Yes, there is less chance of a trade, but the signals are very strong when you are in a higher time frame.
Rule 5: Stop loss / take profit objective
Always remember to place a stop loss and have a good target area. With this strategy, we recommend using a 30-50 pip stop.
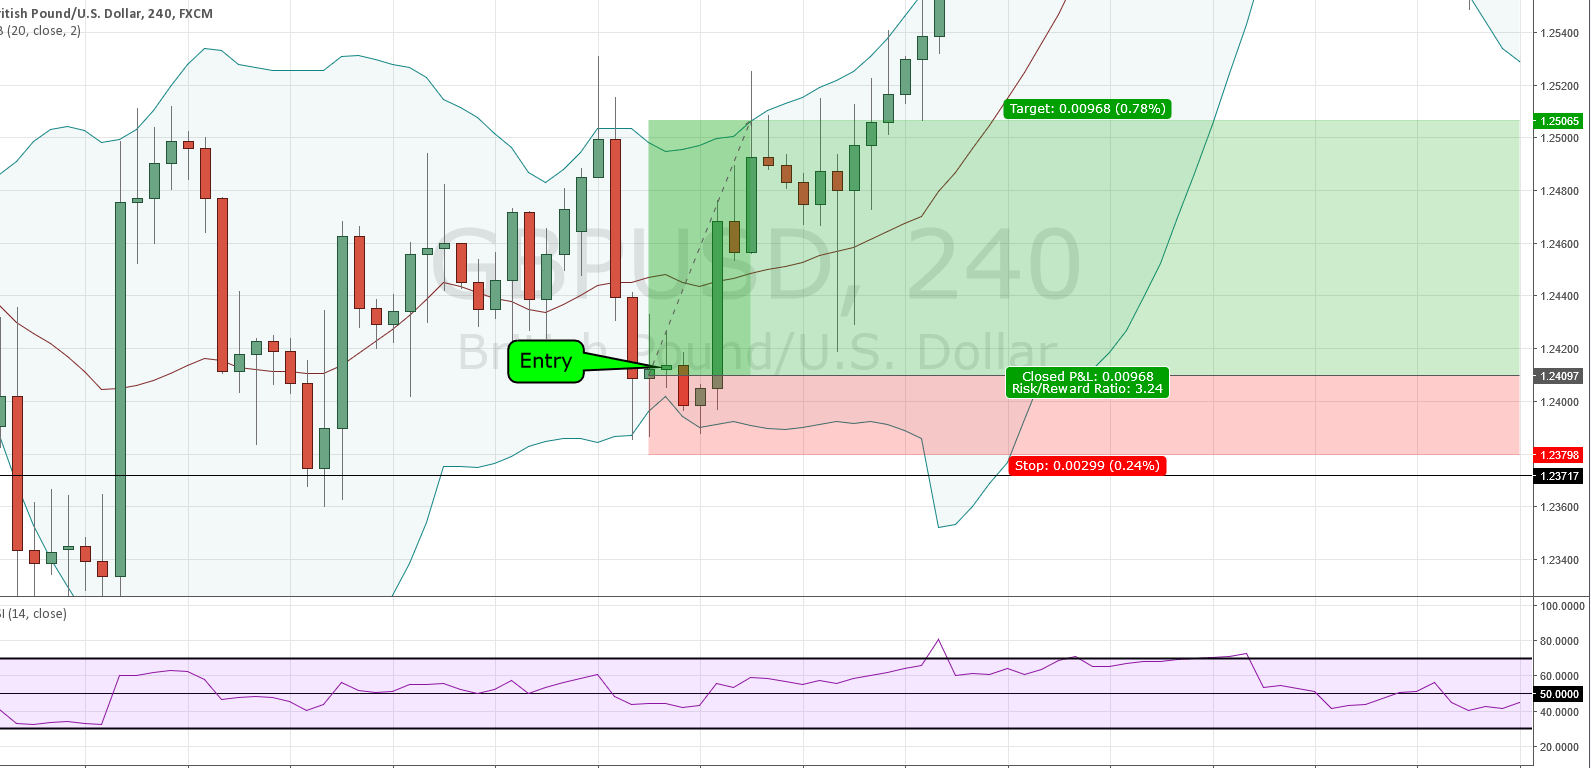
Your profit can be if the price touches the other Bollinger Bands.
Closure
The Bollinger Bands are an excellent indicator to use in any market. Combining this with the RSI indicator should give you excellent entry points. Here is another strategy called trading volume in Forex.
Something else you can consider is when the price touches the middle band. You can make a second entry to print your winners. This can potentially give you double the profit. With this strategy we only use the trade we initially practice. But if your rules allow you to do multiple trades with the same currency pair at once, you may want to consider adding a second position to the centerline.
Click here to read another great trading strategy! This one needs no indicators, just pure price action!
Thanks for reading.