


Strategy is a key element in long-term successful binary options trading. The best binary trading strategies can be defined as: a method or signal that consistently makes a profit. Some strategies may focus on expiration times, such as 60 second, 1 hour or end of day trades, others may use a particular system (such as Martingale) or technical indicators such as moving averages, Bollinger bands or breakouts.
Traders just want a strategy that works. Beginners may be interested in the 3 binary options strategies for beginners detailed in the ‘Strategies for Beginners’ section. More advanced traders can find forex strategies, scalping or arbitrage tips and mt4 strategy. Whatever you want to learn about strategy, you’ll find it here.

This page provides a definitive source for binary trading strategy. No more searching for books, pdf, videos, software downloads or ebooks! These pages contain a number of strategies that work – but remember:
The ultimate binary options strategy is the one you develop yourself, and the one that works best for you.
A guide to strategy
When trading binary options, a winning strategy needs a method to win more trades than it loses, and most importantly, at a payout that exceeds the losses. Digital trades usually pay out less than 100% of the investment amount – so winning more trades than losing is not necessarily enough to make a long-term profit.
The art of binary trading shares some similarities with the world of sports betting. The most important characteristic that connects both enterprises is that of expectation. Binary profits for long-term profit can only be derived if the expectation (the theoretical profit within any trade) results in a positive expectation of the trade.
Binary options trading strategies are therefore used to identify repeatable trends and circumstances, where a trade can be made with a positive (profitable) expectation. It can be as simple as;
- If asset ‘X’ falls in value for three sessions in a row, open a call option for the duration of the next session.
The above is an extremely simple example of a ‘strategy’ in trading. Strategies don’t have to be extremely complicated (although they can be), sometimes the simplest strategies work best.
Types of trading strategy
There are a variety of techniques that can be used to identify a strategy for binary options. New investors want to investigate all of them – each has the ability to be profitable if used correctly.
In addition to the type of basic, or traditional, trading strategy highlighted above, there are also alternative methods;
- Charts and technical analysis charts (the analysis of charts and other technical indicators) are often considered first when discussing strategy. Much has been written about the trends and patterns frequently seen in the price charts, and much of this can be directly translated into trading strategies. It’s not always easy to maintain a simple strategy while trying to practice technical analysis, but it provides a path to insight that isn’t immediately obvious elsewhere.
- Fundamentals – Analysis of the fundamentals is almost a prerequisite for most types of investing or trading. However, with binary options trading, the time scale is too short for the basis to move the price in the expected direction. There are still some binary options trades to be gained from studying the fundamentals, and this is another possible route to a successful strategy. Especially options in the longer term. Some brokers now offer expiration times of one and two months in advance, making this form of strategy much more realistic.
See why price action is important.
The benefits of good trading strategy
A good binary trading strategy will simplify much of the decision-making about where and when to trade. With timing the key to all things trading, the less guesswork there is around entries and exits, the better. Especially for less experienced traders.
A repeatable strategy will always highlight the trading opportunities, where otherwise most of these openings would be missed. Strategies encourage discipline, help money management and provide the clearest predictor for positive expectation. While it is possible for traders to profit from binary options without a strategy, it will be exponentially more difficult.
Beginner traders will also benefit simply by building their own binary options strategy. Time was spent analyzing different methods and building a strategy from scratch. It is much easier to judge strategies offered by others. Without that initial foundation in the art of trading strategies, it would be very easy to be intoxicated by the promise of untold wealth using someone else’s trading strategy or expensive software.
Demo accounts can be a good place to start experimenting with binary options trading strategies without risking any capital. Read our full list of demo account brokers here.
Elements of a profitable strategy
There are three binary strategy elements that every trader should know. In this article, we present each type of strategy and examples for beginners and advanced traders.
In detail you will learn:
- What types of binary options strategies are there?
- Why do I need a trading strategy?
- Why do I need a money management strategy?
- Why do I need an analytics and improvement strategy?
With this information, you will immediately be able to choose the right strategies for you and become a successful binary options trader.
Sub-strategy choices
To create a successful binary options strategy, you need to combine three sub-strategies:
- A trading strategy
- A money management strategy
- An analysis and improvement strategy.
Each of these strategies does a very specific thing for you. To be successful, you need all three. If you don’t have one, the other two become useless.
Let’s look at each type of sub-strategy and see how you can find the right one.
Why use a strategy?
The trading strategy is the most famous type of sub-strategy for binary options. It is so famous that many traders make the mistake of thinking that it is the only strategy they need. But later later. For now, let’s focus on how to find a good trading strategy.
A trading strategy helps you find profitable investment opportunities. It defines which assets you analyze, how you analyze them and how you create signals.
For example, a trading strategy may define that you only trade major currency pairs between 8 and 12 in the morning, that you use a 15-minute price chart and that you invest when you have a ten-period moving average and the Money Flow Index (MFI) both indicate the same direction – for example, the moving average should point upwards, and the MFI should be in an oversold area, or vice versa.
The big advantage of such a definite strategy is that it makes your trading repeatable – you always make the same decisions in the same situations.
Value investing
This way of trading is crucial to your success because binary options is a numbers game. In general, financial investments include the risk of losing trades, but the short timeframes of binary options are particularly volatile. You can never be quite sure what will happen next. Even the best traders win only 70 to 80 percent of their trades. Those with high payout strategies can even make a profit with a winning percentage of 30 percent.
Successful trading does not mean being right all the time. This means being regular enough to make a profit. Think of a coin. If you win 50 percent of your trades and win twice your investment in trades, you know you would break even after 100 times. However, if there was a way for you to increase your winning percentage to 60 percent, you knew you would be making money. The same is true if there was a way to increase your payout. Your trading strategy does exactly that for your binary options trading.
Strike rate
For example, if you trade high/low options, you can expect an average payout of 70 to 75 percent. This means you need to win 60 percent of your trades to make money. A trading strategy helps you identify situations where you know that if you always invest according to your strategy, you will win at least 60 percent of your trades and be able to make a profit.
Without a concrete trading strategy, you would never know if you would win enough trades to make a profit. Some days you may be lucky and earn a lot of money, but on others you will lose half of your account balance. Sooner or later you would have a bad day and lose all your money.
With a trading strategy, you can avoid such a disaster. A trading strategy is an important cornerstone of long-term trading success.
Why use money management?
A money management strategy is the second cornerstone of your trading success. Let’s look at the coin example again. Even if you have a strategy that puts the odds in your favor, for example by guaranteeing that you will win 60 percent of the flips, this strategy will lead to disaster if you always bet your money on every flip. You might win the first one, but soon you’ll lose a flip and all your money will be gone.
To avoid bankruptcy, limit your investments. This is the first goal of a money management strategy.
The second purpose is to help you adjust your investment according to your capabilities. Let’s return to the coin with a strategy that wins you 60 percent of your trades and look at a number of possible money management strategies that would fail:
- Always invest the same amount. If you start with £100 and invest £1 in each trade, you will make a nice profit in the beginning. You would also have plenty of room to survive a streak of bad luck. However, as your account balance increases, your investment will soon become too small. For example, once you reach the £1,000 mark, winning a £1 trade will make almost no difference. The problem with this kind of money management is that it doesn’t grow with you.
- Invest as you feel. Some traders vary their investments based on their intuition. If they feel or won their last trades, they invest more. This strategy is dangerous because losses outweigh wins. If these traders lose a few trades in a row and have invested a little more on these trades, they have lost a large percentage of their total account balance. They have to significantly reduce their investment, which makes it difficult for them to get it back. Step by step they lose more and more money. The holes they dig for themselves will always be bigger than your ability to get out of.
- Invest more after a loss. Some traders increase their investment after a loss, for example by doubling their investment. They hope to eventually win a trade, make a profit and start the cycle all over again. Such strategies work fantastically – until they fail. Even if you choose a very small initial investment, binary options allow you to make so many trades that you will be broke within a year.
Lessons in managing a bankroll
What can we learn from these examples of failed strategies? There are three lessons:
- You must adjust your investment to your total account balance.
- You need to have a precise definition of how much you invest and increase your investment in relation to your total account balance.
- You should decrease your investment after a losing trade and increase it after a winning trade.
To meet all three of these criteria, a good money management strategy always invests a small percentage of your total account balance, preferably 2 to 5 percent. For example, if you decide to invest 2 percent per trade, you would invest £2 with an account balance of £100. If your account balance increases to £200, you would invest £4 per trade and so on.
Whether you should invest 2 percent or 5 percent in each trade depends on your risk tolerance and your strategy. Investing more can earn you more money, but losin
Analysis and improvement strategy
An analysis and improvement strategy is the most overlooked sub-strategy you need. It helps you find the weak points in your trading and improve over time. Without an analytics and improvement strategy, long-term success is at least difficult, if not impossible.
If you are starting out with binary options, you still have a lot to learn. This means trying different strategies, varying the parameter of each strategy and making improvements. It may sound simple, but it is very difficult to find out what works for you and what doesn’t. There are so many variables that it is almost impossible to connect all the dots.
Without an analysis and improvement strategy, newbies lose themselves in the endless complexity of trading. An analysis and improvement strategy makes this complexity manageable.
Definition of analysis
There is no exact definition of what your analysis and improvement strategy should look like, but using a trading diary is by far the most common. In a trading diary, you note every aspect of your decisions. After investing, write down which indicators you used, which time frame, which asset and which expiration. You also write down your location, your mood, the time of day and your trading device. Once the trade is completed, note the result.
After a while you can analyze your diary. You may find that you take significantly more trades in the morning than in the afternoon, that you are a better trader with your phone than with your computer, or that you can interpret moving averages more effectively than candlestick formations.
Spot trends to identify strengths and weaknesses
Regardless of what you find, the result helps you focus on the elements of your trading strategy and your money management that work for you and eliminate everything else. You will get better and better, and eventually you will be good enough to make a profit. By all means, keep your journal, and you can spot mistakes before they cost you a lot of money.
In theory, anything can be your trading diary. Some traders take screenshots, others keep an Excel file and some write old fashioned books. Pick the diary that works for you and you’ll be good to go.
Sub-strategy conclusion
A binary options strategy is your guide to trading success. Although at first it may seem difficult to find the right strategy, with the right information, things are quite simple. You need a trading strategy, a money management strategy, and an analysis and improvement strategy, and you’re good to go.
Specific strategy examples:
60 second expirations
This basic strategy targeting 60 seconds (referred to as 1 minute options at some brokers) is as follows:
1. Find support and resistance levels in the market where bounces can be made in the short term. Pivot points and Fibonacci retracement levels can be particularly useful, just like on other time frames while trading longer-term instruments.
2. Take trade setups with the first touch on the level. If you are trading assets with a high level of noise. I believe that taking a higher volume of trades can actually work to your advantage. 60 second / 1 minute trades definitely fall into this category.
For those who are not familiar with this form of analysis on longer term expiration: The advice is to look for an initial rejection of a price level that has already been marked before the trade. So support and resistance are noticeable. If it rejects the level, it helps to further confirm the robustness of the price level. Trade any subsequent touch . This will result in a lower volume of trades being traded in exchange for trades with higher accuracy. The first touch is not traded, but is used to confirm the following trades. So less trades, but more accurate.
60 second trades lead to a higher trading volume
Since the inherent noise in every 60 second trade is so large to begin with, I believe that the trade can work more often to the trader’s profit. Thereby, it helps to reduce the accuracy fluctuations that arise when trading such short-term flow times.
Overall accuracy of ‘in the money’ trades will drop. This means lower expected value from each trade. However, higher volume can compensate.
For example, 100 trades with an expected profit of 1.25 would yield 125 (profit of 25). But 200 trades at a lower value, say 1.18, would net 236 (profit of 36). So a lower strike rate does not always mean lower profit if more trades can be found over the same period.
Let us take another view. If you trade 60 second options and only take 1-2 trades in a 4 hour session (ie super conservative). It is very likely that you will be waiting a long time before your true trading skill level becomes apparent.
I can be that you are not profitable using 60 second options. Better to find out sooner rather than later.
3. Don’t blindly trade all attention from support and resistance. Continue to consider price action (eg Candlestick types and formations), trend direction and momentum. Also be open to ‘gut feel’. Your trading experience will continue to grow, and your ‘feel’ for the markets will improve. Sometimes these instincts can challenge any other signal. But remember many trading lessons are learned the hard way – with losing trades.
Momentum Strategy
The momentum is an important indicator of the speed with which the price of an asset moves. For binary options traders, this can be both a good way to find trading opportunities and a useful tool for choosing the right type of binary options for the current market environment.
What is a momentum strategy?
The momentum is a technical indicator that compares the price of an asset now with a price in the past. There are different ways to calculate the momentum:
- Absolutely. In this way, the current price is compared with a price in the past and is ignored in between. The most popular absolute interpretation is the momentum indicator, which compares the closing price of the last period with the closing price 14 periods ago (you can also choose any other number, but 14 is the default setting).
- Process oriented. This way of analyzing the momentum looks at each period and calculates the distance the average period has moved. Many technical indicators calculate this value in slightly different ways, but the most popular of them is the average true range.
- Relatively. Some indicators compare the current momentum of the market with a historical average. These indicators help you understand whether the current market environment is better suited for types of binary options that create higher payouts but require strong movements (for example, one-touch options or ladder options) or for their low-risk alternatives that can win trades with smaller movements , but creates lower payouts.
Most of the time, these indicators display their result as a percentage value of the average momentum, with 100 as the baseline. Both indications are similar, but also very different. Let’s see how you can use it to trade binary options.
How can I trade a momentum strategy?
Binary options offer a number of fantastic strategies for trading the momentum. The simplest of them use the momentum indicator and the border options.
Border options are such a great way to trade the momentum because they are the only type of option that allows you to win a trade on momentum alone. Limit options define two strike prices, one above the current market price and one below it. Both target prices are equidistant, and you win your option once the market touches one of the target prices.
This means that it doesn’t matter where the market moves, as long as it moves. The momentum can help you make this prediction. Assume that an asset trades for £100. Your broker offers you a limit option with strike prices of £99 and £101, and if you adjust your momentum to reach your expiry, it says 2.
Now you know that in the recent past the market has moved twice as far as it would have to move to win your border options. This looks like a good investment opportunity. If the momentum was only 0.5, you know it would be a bad time to invest.
5-minute strategy
A good 5 minute strategy is one of the best ways to trade binary options. To get it right, there are a few things you need to know.
What is a 5 minute strategy?
A 5-minute strategy is a strategy for trading binary options with an expiration of 5 minutes. Although there are thousands of possible 5-minute strategies, there are a few criteria that can help you identify the ideal ones. In many traders’ eyes, five-minute expiration is the sweet spot of expiration.
- The market does not move as randomly as it does on shorter time frames, reducing your risk.
- You can still make quite a few trades in a day, increasing your earning potential.
The five-minute expiration is as short as possible, but as long as necessary. With a 5 minute strategy you can take advantage of this perfect connection. Let’s look at two possible 5-minute strategies. Strategy 1: Trade MFI extremes with high / low options With one exception, all 5-minute strategies are based on technical analysis.
Over the next 5 minutes, fundamental influences are unimportant – for example, no stock will rise because the company behind it is doing well. The only thing that matters is the supply and demand ratio on the stock market – although traders are currently buying or selling. Technical analysis is the only way to understand this relationship. The money flow index (MFI) is one of the technical indicators that can best describe the relationship between supply and demand. The MFI compares the number of assets sold to the number of assets bought and generates a value between 0 and 100.
- If the MFI read 0, everyone who wanted to trade the asset wanted to sell it.
- If the MFI read 100, everyone who wanted to trade the asset wanted to buy it.
- Reading the MFI 50, the number of traders wanting to sell the asset was exactly equal to the number of traders wanting to buy it.
The relationship between buying and selling traders can help you understand what will happen next to the price of the asset. Since the price is determined by supply and demand, one side of this relationship becomes a strong movement where too much has already been bought or sold. The market has to turn around.
- If too many traders have already bought an asset, there are too few traders left to push the market up. Demand will exhaust, and the market will fall.
- If too many traders have already sold an asset, there are too few traders left to push the market down. Supply will run out, and the market will rise.
The MFI helps you identify these situations:
- If the MFI reaches a value above 80, the market is overbought. It will probably start falling soon.
- If the MFI achieves a value below 20, the market is oversold. It is likely to start rising soon.
Binary options offer you the ideal tool to trade this prediction:
- Invest in a low option if the MFI reaches a value of more than 80.
- Invest in a high option if the MFI reaches a value below 20.
This strategy works especially well as a 5 minute strategy. During long-term trends (one year or longer), the MFI often remains in the overbought or underbought areas for long periods. Fundamental influences are strong on these timeframes and can push the market in the same direction for years to come. On shorter time frames, fundamental influences are unimportant. It is more important to identify the number of traders left to buy or sell an asset and draw the right conclusions from this indication.
The MFI is the perfect tool for this diagnosis, and binary options are the ideal way to trade it.
5 Min strategy 2: deal with the news
If you feel uncomfortable with a strategy that uses only a mathematical basis for its prediction, there is one alternative to technical analysis as the basis of a 5-minute strategy: trading the news. When important news hits the market, there is usually a quick, strong reaction. You can trade this reaction with a high/low option, a touch option or a ladder option depending on your preference and risk tolerance. This strategy works well as a 5-minute strategy because longer expirations face the threat of other events affecting the market and causing a price change. However, for the next 5 minutes after the announcement of important news, you can be sure that the news will dominate the market.
Rainbow strategy
The rainbow strategy for binary options combines sophisticated predictions with simple signals. It is ideal for traders who want to increase their profits using a proven, successful strategy.
What is a rainbow strategy?
A rainbow strategy is a switching strategy with three moving averages. Most traders use a different color for each moving average, hence the name ͚rainbow͛ strategy. The idea behind the rainbow strategy is simple. Moving averages that use many periods to calculate take longer to react to price changes than moving averages that use fewer periods.
During a strong move, multiple moving averages should therefore move from the slowest to the fastest stock in the direction of the current market price.
- The fastest moving average should be the closest to the current market price.
- The second fastest moving average should be the second closest to the current market price, and so on.
When you see multiple moving averages stacking up in the right way, you know that the market has a strong sense of direction and that now is a good time to invest. This is the basic logic of the rainbow strategy. Theoretically, you could use as many moving averages as you want for this strategy, but the rainbow strategy uses three. Three is a good sweet spot because it keeps things accurate, yet simple enough to handle.
Adding more indicators would not bring any significant increase in accuracy, but only two moving averages would be much less accurate without simplifying things. These three moving averages determine when to invest.
- If the shortest moving average is above the medium moving average which is above the longest moving average, you are investing in rising prices.
- If the shortest moving average is below the medium moving average which is below the longest moving average, you are investing in falling prices.
You can use any number of periods for each moving average. However, there are two rules that you should take into account, but:
- Double the number of periods for each moving average. If your fastest moving average uses 5 periods, for example use 10 and 20 for the slower one. This ratio guarantees that the moving averages are different enough to create meaningful signals, yet similar enough to create signals at all.
- Use popular values. A trading week has five days, so using multiples of five is a good idea for this strategy. These values help you see the same trading opportunities as other traders, increasing the supply and demand that others will create to your advantage.
How to Trade a Rainbow Strategy with Digital Options
To trade the rainbow strategy with binary options, you need to wait for your moving averages to stack up in the right order. If this happens, you have three options to invest:
- Invest immediately. Some traders invest immediately when the final moving average positions itself in the right sequence. This way of trading the rainbow strategy creates the most signals, therefore it offers the most potential, but also the greatest risk.
- Wait a period. Some traders wait if the moving averages stay in order until the next period is over. If so, you’ve lost little time but gained a lot of security knowing that the signal was more than the result of a sideways move.
- Wait for two or more periods. Some traders wait until two or more periods have confirmed the signal. However, waiting too long reduces the accuracy of your signal because the market may have already started to turn. We recommend not waiting more than three periods or ignoring the signal. You can trade this strategy with high/low options, one touch options or ladder options. High / low options are the safest way; learning options have the greatest potential. Based on your personality, especially the risk tolerance, decide which types of binary options are suitable for you.
End of day strategy
An end-of-day strategy for binary options can find you profitable trading opportunities, while only requiring a very limited time investment.
End of day strategy explained
The strategy at the end of the day is less of a strategy that tells you what signals to use and more of a strategy that lets you know when to look for signals. The strategy assumes that the best time of day to trade is at the end of the day.
The end of the trading day exhibits some unique characteristics. This is mostly due to the fact that day traders stop trading when a stock exchange is about to close.
Day traders are traders who never hold overnight positions. They invest in the short term and argue that a lot can happen overnight, and it is therefore unwise to hold a position during this time.
Since there are many day traders, their absence significantly reduces the trading volume. The market is a little slower and does things it would be unlikely to do at any other time of the day. Traders with an end-of-day strategy wait for this environment, arguing that signals are clearer and trading opportunities are better.
Trading options in the end
While you can theoretically trade any trading strategy at the end of a trading day, there are a few strategies that work particularly well during this time. Let’s look at the most profitable of them: trading gaps.
It is especially likely during times of low volume that the gaps are closed, which is why the end of the trading day is the best time of day to trade them. The accurate predictions to close gaps make it especially attractive to traders with higher paying types of binary options, such as one touch options.
A gap is a jump in price action. For example, if an asset is trading at £100 and jumps to £100.1 without covering the range in between (without trading for £100.01, £100.02, and so on), this creates a gap of £0.1.
Depending on how this gap was created, it can mean different things. A gap accompanied by a large volume is probably the result of important news reaching the market, which is likely to start a strong new movement. However, near the end of the trading day, such gaps almost never occur.
What we do find are gaps that are likely to close.
Near the end of the trading day, there are so few traders left in the market that a few traders, possibly even a single trader, is enough to make the market jump. The resulting gaps are weak because they are the result of a single person’s decision. Most other traders will consider the advance unjustified and invest in the opposite direction:
- If the gap points upwards, most traders will consider the new price too high. They will sell their assets.
- If the gap points down, most traders will consider the new price too low. They will buy new assets.
Due to both reasons, the gaps that occur near the end of the day are likely to close.
With this knowledge, you can trade a one-test option. If your broker offers you a one-push option with a strike price within range of the gap, you know that the market is likely to reach this strike price. Also invest if the expiry is reasonable.
Alternatively, you can also trade a high/low option that predicts a gap.
Decay strategy
Base Line Expiry
I learned a long time ago how to judge the duration of a given signal. Okay before I start trading binary options. Here I will explain how you can develop a strategy for expiration. The first thing to do is identify what your signal is. Is it a:
- trend line bounce
- stochastic transition
- shift in momentum
- candlestick pattern
- or a combination
When you are done, you go over your charts again for a given period and identify all the signals. The time frame is not important at this stage, this technique works in all respects. Mark the strong signals and weak signals. Now count how many bars or candles it takes for each signal to invest in the money.
Once done, you can average the number of beams you need. Both for the strong and for the weak signals to invest in the money. These averages are now your base date for the signal. If you are using a chart of hourly prices and your signal takes an average of 3.7 candles to invest in the money, you want to use an expiration that coincides with that time. It can be a mid day, end of day, 4 hours or another option. Regardless of the expiration of your signal horizon. If the signals take 3.7 candles, and you use a daily chart that means 3.7 days. Using the hour chart, this means 3.7 hours, and so on.
Study the chart below. I’m going to use a basic moving average strategy to demonstrate. I will use the 30 bar exponential moving average. It pinches prices closer than a simple moving average and gives us more signals to count.
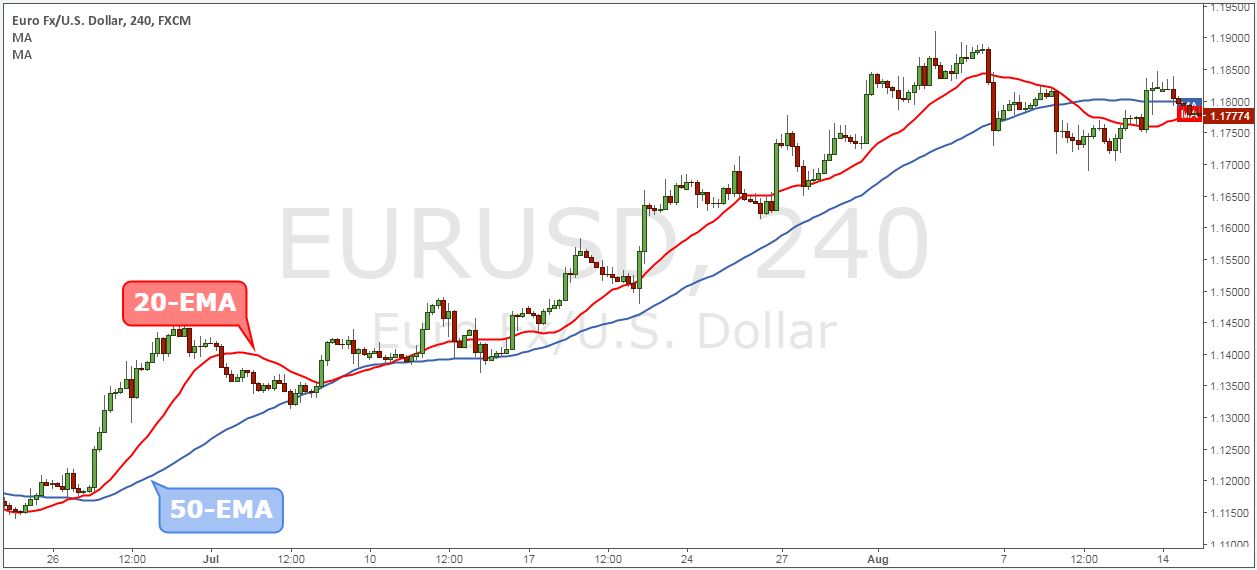
To eliminate bad signals and improve results, I only choose the bullish trend following signals. So there are 15 total signals. 6 weaker signals and 9 stronger signals. It takes an average of 4.2 measures to invest these signals in the money and peak.
Since this is an hourly chart, each signal will move towards profitability and reach the peak of that move within 4 hours. So I would like to select the expiration date up to 4 hours which is available. If a good choice is not available, no comfort can be easily traded. Don’t try to force trades where they don’t fit.
Breaking it down a bit, the weak signals peak in about 2.6 hours versus the stronger signals. Stronger signals take about 5.3 hours. Putting this knowledge into perspective, a weaker signal may be one that is near resistance. A stronger signal can be that which is not near resistance. There can also be a stronger signal where the price action leaves a long white candle and definitely moves above or off the moving average, while a weaker one can only create small candles and pivots.
Additional tips for choosing the expiration of binary options
Choosing an expiration is one of the most important factors in trading. The other most important factor is direction. All too often I am asked questions about why the trade has done badly in the last moments. One of the most common mistakes I find is choosing the expiration.
Of course, errors in analysis, trends or random events can also occur. But the focus of this discussion is decay. Obviously, you don’t want to use the 60 second expiration when trading on weekly charts. Just as clearly, you will not want to use the end of day expiration if you are trading the 60 second charts. So how can you determine the best expiration?
One question you need to ask yourself is: if you are trading with or against the trend.
If I were trading against the trend, I would suggest a shorter expiration rather than a longer one. Actually because there is less chance for an extended counter to the trend. Your expiration should be more precise. If you trade with the trend, your expiration can go a little further.
A trend after trade has a higher chance of closing the money, and therefore does not need to be as precise. A signal that follows the trend is most likely more in the money than one that goes against the trend.
Another factor that can have a big impact on which expiration is best for a given trade is support and resistance. The relative level of prices to a support or resistance line is a factor in the likelihood that a trade will move in a given direction.
If prices are near an S/R line and move away, your option is much more likely to close money than if prices are near an S/R line and move after it. If prices move towards one of these lines, the chance of the movement being stopped and/or reversed is much greater than if prices move away from one.
So how does this apply to expiration? If you are taking a signal that has a higher chance of being stopped or reversed, you will want to choose a shorter expiration than if the same signal is not facing an S/R level. I purposely did not call or put, or bullish or bearish, as this applies to both bullish and bearish trades. Also remember that support and resistance can be in the form of lines drawn on areas of interesting price action or peaks, moving averages, Fibonacci’s, envelopes and bands.
1-hour strategy
Binary options can make you a profit of 70 percent or more within an hour. Compare this to stocks, and you understand why binary options are so successful. To trade an hour strategy with binary options, there are a few things you need to know. This article explains it.
In detail, you will learn the three important steps to trading a 1 hour strategy with binary options, namely:
- Step 1: Find the right indicators
- Step 2: Find the right time frame
- Step 3: Find the right type of binary options
With these three steps, you will be able to create and trade a successful 1 hour strategy with binary options immediately.
| Pattern matching strategy | Numerical strategy | |
| High reward, fast | Simple candlestick analysis. This strategy trades special formations consisting of only one to three candlesticks. Finding these formations is quick and easy, but it lacks the reliability of more complicated signals. However, because there are so many candlesticks, executing this strategy will get you more trades than with other strategies. | Trade extreme areas of the MFI. The Money Flow Index (MFI) creates a value between 0 and 100 that indicates the strength of a movement. Values over 80 indicate that there is little room left to rise, values below 20 indicate that there is little room left to fall. All you have to do to trade these predictions is to invest in a low option when the market reaches a value above 80 and a high option when the market reaches a value below 20. This strategy can create many signals, but since it is based on a single technical indicator, it is also risky. |
| High reward, detailed | Swing handel . During trends, the market fluctuates up and down. Swing traders try to take advantage of each of these movements. This strategy gives you many trading opportunities during a trend, but trading a single swing is always riskier than trading the trend as a whole. | Trade the ATR and the ADX with border options. The ATR calculates the average range of movements of the past, the ADX is its directional strength. With both values, you can predict whether the market has enough energy to reach one of the target prices. This strategy can create many signals and create a high payout, but is also risky. |
| Low risk, fast | Three moving average crossovers. Combining three moving averages can create very safe signals. You have to do almost nothing to execute the strategy. Simply sit back and wait for your software to create a signal. On the downside, this strategy will create few signals, limiting its potential. | Trade MFI deviations. If the MFI’s movement does not reflect the market, the current trend is deep trouble. For example, if the market makes a new high during an uptrend, but the MFI fails to make a new high, the market will soon turn downward. You can take advantage of this prediction by investing in a low option. This strategy can create safe signals with little time investment. |
| Low risk, detailed | Continuation and reversal patterns. Continuation patterns are major price formations that allow for accurate predictions. These patterns are rare, but you can achieve a high percentage of your trades. | Combines various technical indicators. On their own, all technical indicators are unreliable. But if you combine several indicators, you can filter out bad signals and create a more reliable strategy. For example, it makes sense to combine the MFI with the RSI or the ADX. These strategies will create fewer signals because you are filtering some of them. |
Step 2: Find the right time frame
Once you have found the right indicator, you need to think about which time frame to use. We create a strategy with an expiration of 1 hour, which gives you the first indication. However, depending on which indicator you use, you need to trade a completely different time frame.
The time frame of your chart defines the amount of time that is aggregated into one candlestick. For example, if you are looking at a chart with a 15-minute time frame, each candlestick on your chart represents 15 minutes of the market movements. When looking at a chart with a 1-hour time frame, each candlestick represents an hourly movement of the market.
If you create your signals in a chart with a 15 minute time frame, you create different signals than in a chart with a 1 hour time frame. To trade a successful 1 hour strategy, you need to find the type of signals that are perfect for your indicator.
For a 1 hour strategy, each indicator needs a specific time frame that corresponds to the expiration of the time for which the indicator’s predictor is valid. Let’s take a look at our matching examples:
- Simple candlesticks work best with a time frame of 1 hour. Simple candlesticks consist of only one to three candlesticks, and therefore their predictions only apply to the next candlestick. After that, other influences are likely to dominate the candlestick, and it loses its predictive power. Therefore, you should take care to only trade forecasts that expire within the next candlestick. With the expiration of 1 hour, it means using a time frame of 1 hour.
- Keep your time frame around 5 to 10 minutes for swing trading. Swings need some time to develop. If you trade a chart with a time frame of 5 minutes and an expiration of 1 hour, you give the candlestick 12 candlesticks to develop. This is a good value for most trends. If you find that your timing is a little off, you can also try a 10-minute card.
- Three moving average crossovers work best with a time frame of 1 to 5 minutes. If you are trading three moving average crossovers, you are looking for a move that contains many candlesticks. It is also probably best to trade three moving averages on a 5-minute time frame, but if you want to give your moves more time, you can also switch to a 1-minute chart. Everything else would be too long or too short, respectively.
- Reversal and continuation patterns offer many opportunities. You can trade continuation and reversal patterns by trading the long movement that they indicate, or by trading the short momentum that occurs after the completion of the pattern. In the first case, you should use a time frame of 5 to 10 minutes to give the movement enough time to develop. In the second case, you should trade a time frame of 4 hours or even 1 day to make sure that you are truly trading the rate and not much more.
As you can see from this list, the type of indicator predetermines the time frame you should use for the 1 hour expiration. Some indicators predict where the next candlestick will go, in which case you need a long expiration to match the length of one candlestick to your expiration. Other indicators predict long moves, in which case you should trade a shorter time frame to give the market enough time to develop an entire move.
This rule also applies to the numerical strategies:
- Trading in the extremes of the MFI works best with a time frame of 5 to 10 minutes. This strategy allows for two trading styles. Some traders like to invest when the MFI enters extreme territory; some invest if it leaves the extreme. The first type should use a shorter time frame to give the market more time, ideally for 5 minutes. The second type can trade a longer time frame, preferably 10 minutes.
- For MFI deviations, use a 1-minute or 5-minute time frame. If the MFI deviates from the market, it may take a few periods for the market to catch up. Keep the time frame short to create these signals in an environment that is ideal for a 1-hour strategy. 1-minute or 5-minute cards provide the ideal environment for this strategy.
- Use a 15-minute chart for various technical indicators. When you combine several technical indicators, your signals create short to medium signals. It works best with a time frame of 15 minutes. Of course, your ideal time frame depends on your final strategy and the technical indicators you use. If necessary, adjust your time frame.
These recommendations are a good starting point for each strategy. However, remember that these are only recommendations. Every trader is different, and if you find that you can achieve better results with a different time frame than our recommendation, then use what works. There is no right and wrong except what makes or loses your money.
Step 3: Find the right type of trade
After matching your indicator to a time frame, you need to adjust it to a type of binary options. Binary options offer many different types, and each type has a unique relationship between risk and reward.
To explain how binary options types relate to your strategy, let’s look at the different types of options. You will see that it is difficult to give general recommendations, but some binary options suit some strategies better than others.
- High / Low options are the classic option type that allows you to predict whether the market will rise or fall over a period of time, in our case 1 hour. Since high/low options allow you to win a trade with the smallest possible move in the right direction, this is the low-risk way to trade for all of these strategies. Executed well, each strategy should earn you a high enough percentage to turn a profit.
- One touch options define a strike price, and you win your option when the market reaches this strike price. The market does not have to stay at this strike price, which is a big advantage, but you need a stronger move because the strike price is further away. One touch options are well suited for trading continuation and reversal patterns and simple candlesticks that predict strong movements, for example the large candle. The power too
- Ladder options define multiple target prices and allow you to determine whether the market will close above or below each strike price. It allows for risky predictions that can create the highest payouts of all binary options and for safe predictions that allow for a high win percentage. Traders with pattern matching strategies in particular may benefit disproportionately from this premise.
- Border options are one touch options with two strike prices, one above the current market price and one below it. Obviously, border options are ideal for trading the ATR and the ADX. Border options are the only type you should trade this strategy with. For all other strategies, border options are not good. All of these strategies provide clear predictions for where the market is going. Border options do not require you to predict a direction, which means you waste part of your prediction. If you trade a one touch option, you would get a higher payout and win just as many trades.
1-hour strategies that require special trading times
The beauty of all strategies in this post is that they work well in any market environment and at any time. Hence, any trader can use it. However, there are also strategies that specialize in a specific trading environment or a specific time. These strategies may be better suited for traders who intend to trade these environments anyway.
The most prominent example of this kind of strategy is closing gaps. There are gaps in market prices when the market jumps from one price level to a much higher or much lower price level.
- If gaps are accompanied by high trading volume, this may indicate the beginning of a new movement or the strengthening of an existing one. Many traders support the gap, and there is enough momentum to push the price in the direction of the gap.
- If gaps are accompanied by low trading volume, they are likely to close. Few traders support the gap, and most traders probably consider it an unjustified advance. They will invest in the opposite direction, and the gap will widen.
The beauty of closing gaps is that it provides you with one of the most accurate predictions you can find with binary options. The gap is likely to close within the next period that you exactly expire, and the size of the gap gives you a clear strike price.
Alternative trade types
With this information, you can trade a one-push option or even a learning option. You get a high payout and you should be able to win a high percentage of your trades, which means you have a powerful strategy at hand.
The downside of this strategy is that it is difficult to find gaps that are accompanied by low volume during most trading times. There are simply too many traders in the market to create a gap with low volume. Therefore, low-volume gaps mostly occur at the end of the trading day.
Many traders are day traders. They close their position at the end of the day and never hold a position overnight. These traders will stop trading when the market is about to close because there is not enough time to complete another trade.
Trading Hours
When day traders have left the market, trading will drop significantly. Now you can find closing gaps. Monitor all time frames from 15 minutes to 1 hour, and trade any gaps you find with a one-test option with a 1-hour expiration that predicts a closing gap.
Traders who work during the day and can only trade after work can use this strategy to make profits despite their work.
The important point here is that you can trade successfully even if your time is limited. If you need to trade during your lunch break, you can also find successful strategies for this limitation.
As with everything in life, success means taking advantage of your limitations. With binary options, your limitations can help you trade more successfully than if you didn’t.
1 hour strategy overview
A 1 hour strategy is one of the most popular types of trading strategies. It combines an expiration that seems natural to us with a wide variety of possible indicators and types of binary options, which means that every trader can create a strategy that is ideal for them.
Whether you prefer a pattern matching or a numerical strategy, a high potential or a low risk approach and a simple or a complex forecast, you can create a 1 hour strategy based on any combination of these attributes .
Unless you trade limit options with the ATR and the ADX, we recommend that you start with high / low options – this is the easiest type for newbies.
Double red strategy
The double red strategy is a simple strategy that allows binary options traders to find many trading opportunities. Here’s how to perform it.
What is the double red strategy?
The double red strategy is a trading strategy that seeks to identify markets with falling prices. The ‘double red’ in the name refers to the fact that the strategy waits for two periods of falling prices in a row before creating a trading signal – periods with falling periods are often colored red in the trading charts.
The logic is simple: the market often takes time to sort itself out at significant price levels. However, after it has sorted itself out, the downward price movement is often stronger and more linear than an upward movement, which is why it is an excellent investment opportunity.
For example, assume there is a resistor. When the market approaches this resistance, it will never reverse immediately. It will edge itself closer and closer, test the resistance a few times and finally turn around. Although the reversal would be a good trading opportunity, finding the right timing is difficult. During the process of moving closer and closer to the resistance, the market will already create some periods with falling prices that cannot lead to a reversal. You should avoid investing in these periods.
To find the right timing, the double red strategy waits for a second consecutive period of falling prices that confirms the reversal. When such a period occurs, the market has apparently stopped moving against the resistance and started moving away from it again. Double red traders would invest now.
How to execute the double red strategy
To execute the double red strategy with binary options, this is what you do:
- Choose a short period for your card. Binary options are short-term investments, and your time period should reflect that. Choose a period between 5 minutes and 1 hour.
- Find a resistance level. Sometimes you find a resistance level right in the chart. If the price itself does not offer any resistance levels, you can add technical indicators. Bollinger Bands and technical indicators with a significant number of periods (for example, 20, 50, 100, 200) usually provide major resistance levels that will influence the market.
- Invest if you get two red periods in a row. Once the market approaches the resistance, you need to closely monitor price movements. Once you see two periods in a row, predict falling prices. Most traders use low options for this strategy.
If you add another indicator (for example, the average true range) and want to take a little more risk, you can also use one-to-one options or options.
Keep your expiration short. The double red strategy creates signals based on two candlesticks, which means that its predictions are only valid for very few candlesticks. Ideally, you would limit your expiration to one or two candlesticks. For example, on a 15-minute card, you would use an expiration of 15 to 30 minutes.
Strategies for beginners
We have the three best strategies for beginners, from high potential to risk averse
- What should beginners know?
- A risk-averse strategy: follow trends
- A strategy with high potential: swing trading
- An interim strategy: trading in gaps
With this information, you can find the best strategy to start trading binary options as a complete newbie.
What should beginners know?
Binary options strategies for newbies must meet some special criteria. It should be simple but effective, quickly understandable but profitable. There are many complicated strategies that can make money if a trader executes them perfectly.
However, beginners will get overwhelmed, make mistakes and lose money. The goal of a good strategy for newcomers to produce similar positive results, while simplifying the strategy.
Let’s look at some strategies that can meet these criteria. We offer a risk-averse strategy for the traders who want to play it safe, a riskier strategy for those who want to maximize their earnings, and an intermediate version.
Risk averse beginner method: follow trends
Following trends is a safe, simple strategy that even novices can execute. Trends are long-term movements that take the markets to new highs and lows.
- Movements that take the market to new highs are called trends,
- Movements that take the market to new lows are called downtrends.
The trick with trends is to understand that they never move in a straight line. The price of an asset is determined by the relationship between supply and demand, and there is no perfect movement where the supply is always greater than the demand or vice versa. It is simply possible for all traders to buy or sell continuously. There must always be short periods during which the market gathers new momentum.
These periods are called consolidations. During a consolidation, the market turns or moves sideways until enough traders are willing to invest in the main trend direction.
The alternation of movement and consolidation creates a zig line in a specific direction. This is a trend.
- An uptrend takes the market two steps up, then one step down, and then two steps up again. And so on.
- A downtrend takes the market down two steps, then up one step, and then down two steps again. And so on.
Finding trends
If you look at the price charts of stocks, currencies or commodities that have risen or fallen for long periods of time, you will find trends behind them all. Trends can last for years, but the more you zoom into a price chart, the more you’ll see that every movement that looked like it was looked at in a daily chart becomes a trend on a 1-hour chart. What looks like a straight move on a 1-hour chart becomes a trend on a 10-minute chart, and so on.
There are many levels of trends. Regardless of what time frame you want to trade, there is always a trend you can find.
To follow a trend once you’ve identified it, you have a few different options:
- Invest in a high / low option: this is the simplest strategy. Invest in a high option if you recognize a trend; invest in a low option if you find a downtrend. Choose your expiration from as long as a full cycle. If an uptrend takes 30 minutes to create a new high and low, choose an expiration of 30 minutes. Then the market must definitely be higher than now. If you want, you can also use an expiration two or three times as long as a cycle. Just stick to a multiple of the typical length of the cycle. Once you are comfortable with this strategy, you can consider monitoring failures with the Money Flow Index (MFI) and the Relative Strength Index (RSI) to evaluate the remaining strength of a trend or to find a moving average at your add strategy.
- Invest in a one touch option: Once you find a trend, you can predict how fast the market will rise or fall. For example, if you know that a trend has increased the price of an asset by £0.1 every 15 minutes, you can calculate the trajectory of the trend and invest in a one-push option. If your broker offers you a one-push option with a strike price of £0.15 away from the current market price and an expiry of 30 minutes, you know that there is a high chance that the market will reach this strike price. Find a trend, check the brokerage options for your broker, and if you find one within range, invest.
- Combine Both Strategies: You can also combine both strategies. When you find a trend, you invest in a high / low option in the direction of the trend and calculate whether it makes sense to invest in a one-test option. If so, invest in both options; if not, just stick to the high/low option.
Since these are relatively safe strategies, you can afford to invest a little more in each trade. We recommend somewhere between 3 and 5 percent of your total account balance.
High-Potential Beginner Strategy: Trade Swings
Trading swings is a variation of our first strategy, following trends. A swing is a single movement in a trend, from high to low or vice versa. Each cycle of a trend consists of two swings: one upswing and one downswing.
Instead of trading a trend as a whole (like trend followers), swing traders want to trade each swing in a trend separately.
The advantage of this strategy is that each trend offers them several trading opportunities, and not just one.
More trading opportunities means more potential winning trades, and more winning trades means more money.
The downside of this strategy is that trading a swing is riskier than trading a trend as a whole. You’re trading greater potential for greater risk – whether that’s a good idea depends on your personality.
- Some traders lose interest if they only trade one option in a trend. They run the risk of abandoning their strategy and making bad decisions. These traders will do better with a swing trading strategy.
- Some trades will get nervous following the third or fourth consecutive swing. Afraid that the trend will end soon, they will deviate from their strategy and make bad decisions. These traders can do better by following the trend in its entirety.
Investment levels
If you decide to become a swing trader, we recommend using a low to medium investment per trade, ideally between 2 and 3.5 percent of your total account balance. Only traders who like to take risks should invest more, but never more than 5 percent of their total account balance.
Choose your expiration date based on the length of a typical swing. If you expect an upswing and a typical upswing to last around 30 minutes, use an expiration of 30 minutes. Choosing the right expiration is no science, and you will need some experience to find the perfect timing.
To use technical indicators, you can use technical indicators. Momentum indicators such as the Relative Strength Index (RSI) or the Money Flow Index (MFI) are popular choices, as are moving averages.
The Strategy for Intermediate Beginners: Trading Gaps
Trade gaps combine an intermediate risk with a good chance of high profits. The strategy is simple enough for beginners to learn it in a few hours.
Gaps are price increases in the market. At the end of one period, something strongly affected the market, and the price jumped to a higher or lower level with the opening price of the next period. Candlestick charts are ideal for finding gaps because they visualize well the gap between the closing price of one period and the opening price of the next period.
Gap types
The most common gap is the overnight gap. When the stock market opens in the morning, all the new orders placed overnight flow. If traders are optimistic or pessimistic, chances are that most of these orders point in the same direction. The market opens significantly higher or lower, and there is a gap between yesterday’s last price and today’s first price.
Such a gap is an important event because the same assets are suddenly much more expensive. The market may react in shock; some traders may take their profits; or the market can move forward, provided it is the start of a strong move.
To know how to take advantage of gaps, you need to know these three types of gaps:
- Breakaway gaps. Breakaway gaps occur during lateral movements. In these periods, the market is unsure of where it wants to go and builds momentum for the next move. If prices jump up or down and this jump is accompanied by high volume, the market has created enough momentum to start a new move.
- You can take advantage of this knowledge and invest in a high option in the direction of the gap. Since you expect a longer movement, choose your card’s expiration longer than one period. For example, if you are trading a 15-minute chart, then use an expiration of at least 15 minutes.
- Gear gaps. Acceleration gaps occur during a trend. While the asset is already trending up or down, something must have happened that strengthened this momentum. The market jumps in the direction of the trend and creates. In an uptrend, acceleration gaps always occur in an upward direction; in a downtrend, acceleration gaps always occur in a downward direction.
- Like breakaway gaps, the acceleration gaps are accompanied by high volume. Use a similar expiration to breakout gaps. Acceleration gaps also allow you to invest in a one touch option because after the gap the trend will move faster than before the gap. If your broker offers you a one-touch option that would have been just outside the reach of the previous trend, you know that chances are good that the accelerating trend will reach it. This could be a good opportunity.
- Exhaustion gaps. Exit gaps are very different from the first two gap types because they indicate an impending reversal. Exhaust gaps occur during a strong movement in the direction of the movement – just like acceleration gaps. The difference between both types of gaps is that the exit gaps are accompanied by low volume and that the market already starts to reverse during the period. After an exhaustion gap, the market will likely close the preceding gap, giving you the opportunity to trade a one touch option or a high/low option.
General gaps. Common gaps occur during lateral movements. It is accompanied by a normal volume and represents random movements with little long-term significance. Since common gaps are likely to close, you can invest in a one-touch option or a high/low option.
Price jumps
The basic principle of all four gaps is the same. Gaps are important price moves, so many traders now have an incentive to take their profits or enter the market. Both forces push in the opposite direction of the chasm and are likely to close it. To keep a gap open and create a new move, the gap must be accompanied by a large volume. This high volume indicates that many traders support the gap, and that there are few people who will take their profits or immediately invest in the opposite direction.
Beginner Strategy – Conclusions
Even complete beginners and novices can find a simple but effective strategy that can earn them money.
- Risk-averse traders can follow trends as a whole.
- Traders who are willing to take risks if it increases their potential can swing.
- Traders who want a good mix of risk and potential can trade gaps.
Zero-risk strategy
With Binary Options, a zero risk strategy is the dream of any financial investor. Although it is impossible with any investment, binary options can get you closer than anything else.
Is a zero-risk strategy possible?
When investing, there is always some risk involved. Despite all efforts to predict what the market will do next, no one has yet found a strategy that is always right. Sometimes the market moves in unpredictable ways and does things that seem irrational.
In reflection, we often find good explanations for these events. As a trader, you need to avoid letting this boom after bust confuse you. When a trading day is over, it is easy to say that this event moved the market the strongest. But when a trading day begins, it is almost impossible to predict which of the many events of the day will have the strongest influence on the market and how it will affect the market. Even outside of the stock market, financial investments always involve some degree of risk.
- When you invest in fixed rate securities, there is always the chance that the bank that issued them will have to file for bankruptcy. Many countries protect your money up to a certain amount, but beyond that the risk is yours.
- When you buy government bonds, there is always the chance that the government will go bankrupt. Since bonds take up to 30 years to expire, a lot can happen over this time.
Simply put: a zero-risk strategy is impossible with any asset. But binary options offer some tools that allow you to get relatively close to zero risk. Let’s see how you can do it.
How to get close to a zero risk strategy
Most binary options brokers offer a great tool: a demo account. Demo accounts work just like regular accounts, but allow you to trade with play money instead of real money. In the risk-free environment of a demo account, you can learn how to trade.
You can try different strategies, find the one that suits you best and make it perfect. You can wait to switch to real money trading until you have a solid strategy that you know will make you money by the end of the month. While many stockbrokers also offer a demo account, binary options have one major advantage: binary options work on a shorter time scale, which means you learn faster and better.
- When you buy a stock, you have to wait months or years until you know if you made the right decision. Meanwhile, many unique things happen, and therefore you conclude that the situation is unrepeatable and that you have learned nothing.
- When you trade a binary option, you know within a few minutes if you made the right decision. In the meantime, there are no events that distort your result. If your option expires, you will get a clear result. You know whether you have done work or not. Because binary options work on such a short time scale, they allow you to create and test a strategy much better than any other type of investment.
Once you have traded a strategy with a demo account and made a profit for several months in a row, you know that there is a very high chance that you will make a profit if you start trading money as well. There will still be some risk, but binary options have helped you eliminate as much risk as possible.
For those still looking for zero-risk trades, Arbitrage is another option.
Breek strategie
Die break-out strategie maak gebruik van een van die sterkste en mees voorspelbare gebeure van tegniese ontleding: die breakout.
Wat is ‘n wegbreek?
Uitbrake vind plaas wanneer die mark ‘n kaartvorming voltooi. Hierdie voltooiings dui op wesenlike veranderinge in die markomgewing. Die mark sal ‘n sterk opwaartse of afwaartse momentum opneem, wat beteken dat baie handelaars op die verandering moet reageer.
- Sommige handelaars sal hul posisies sluit omdat die gebeurtenis hul voorspellings negatief maak. As ‘n handelaar stygende pryse voorspel, maar ‘n gebeurtenis dui daarop dat pryse sal daal, sal hierdie handelaar hul posisie sluit voordat hy geld verloor.
- Sommige handelaars sal nuwe posisies open wat in die rigting van die nuwe neiging wys.
- Baie handelaars sal albei doen. As ‘n handelaar kan voorspel waarheen die mark gaan, is daar geen rede waarom hulle nie hierdie voorspelling moet verhandel nie. Handelaars wat besef dat hul oorspronklike voorspelling verkeerd was, sal waarskynlik in die teenoorgestelde rigting belê.
Al hierdie drie moontlikhede skep ‘n sterk momentum in dieselfde rigting.
- As die mark ‘n afwaartse formasie voltooi, sal sommige handelaars die bate kort verkoop; sommige sal hul lang posisies verkoop. Albei aksies skep afwaartse momentum.
- As die mark ‘n opwaartse formasie voltooi, sal sommige handelaars die bate koop; sommige sal hul kort posisies sluit. Albei aksies skep opwaartse momentum.
Aangesien die meeste handelaars die uitbetaling verwag, plaas hulle bestellings wat outomaties geaktiveer word wanneer die mark die prysvlak bereik wat die prysvorming voltooi. Hierdie bestellings versterk die momentum nog meer.
Hoe kan ek die breakout met ‘n strategie verhandel?
Digitale opsies bied ‘n aantal strategieë om die breakout te verhandel. Hier is die drie gewildste strategieë:
1. Verhandel die tempo met hoë / lae opsies . Wag totdat die mark uitbreek as u ‘n wegbreekpunt verwag. Sodra dit gebeur, belê in ‘n hoë / lae opsie in die rigting van die wegbreek. As die uitbraak in ‘n opwaartse rigting plaasvind, belê in ‘n hoë opsie; as die uitbreek in ‘n afwaartse rigting plaasvind, belê in ‘n lae opsie. Gebruik ‘n vervaldatum gelykstaande aan die lengte van een periode. Dit is die lae-risiko / lae-beloning manier om die breakout te verhandel.
2. Verhandel die breakout met een raakopsies. Breakouts is sterk bewegings, en daarom is dit ideaal om ‘n een raak opsie te verhandel. Een raakopsies definieer ‘n trefprys, en u wen u handel wanneer die mark hierdie trefprys raak. Sodra u die mark sien uitbreek, belê u in ‘n eentoetsopsie in die rigting van die wegbreek. Dit is die medium-risiko / medium-beloning manier om die breakout te verhandel.
3. Verhandel die skeuring met leeropsies . As ‘n bate uitbreek, belê u in ‘n leeropsie in die rigting van die wegbreek. Kies ‘n trefprys waarmee u gemaklik voel, maar dit bied u steeds ‘n hoë uitbetaling. Dit is die manier waarop u die tempo kan verhandel, met ‘n hoë risiko / beloning. Al hierdie drie strategieë kan werk. Kies die een wat die beste by u persoonlikheid pas.
Three strategies for Bollinger Bands
There are hundreds of strategies that use Bollinger Bands. Regardless of what strategy you use, there is almost no downside to adding Bollinger Bands to your chart. Even if you do not directly do this or trade, you will not confuse three extra lines. On the contrary, it will subconsciously influence you to make better decisions.
Nevertheless, we will now present three strategies that not only contain Bollinger Bands, but use them as their main component. Understand these strategies and you will also be able to use Bollinger Bands in your strategy.
Strategy 1: Trade Foreign Bollinger Bands with High / Low Options
This is the simplest strategy, and the one with the least risk. This can be explained in two simple steps:
- Compare the current market price with the price range of the Bollinger Bands.
- If the market is near the upper end of the Bollinger Bands, invest in falling prices with a low option. If the market is near the bottom of the Bollinger Bands, invest in rising prices with a high option.
That’s it. Even newbies can execute this strategy instantly.
However, there is one thing you should know. Since each new period moves the Bollinger Bands, the highest range of the current Bollinger Bands may not be the upper range of the following periods. A rapidly rising market will also push the Bollinger Bands upwards; and a rapidly declining market will cause the Bollinger Bands to decline with it.
Because of this limitation, the strategy works best if you keep the expiration of your binary option shorter than the time until your chart creates a new period. If there are 30 minutes left in your current period and the market is approaching the top of the Bollinger Bands, it makes sense to invest in a low option with an expiration of 30 minutes or less.
If you want, you can also check your forecast on a shorter period. Switch to a chart with a 15-minute period, and if the market is near the upper range of the Bollinger Bands, you know that there is a good chance that it will go down soon. However, if it is in the middle of this trading range, you may want to consider passing on this trade.
You can also consider upgrading this strategy to trade types of binary options with a higher payout. Adding a momentum indicator allows you to invest in option types that require strong movement. Consider the example of our next strategy to understand how to add this indicator.
Strategy 2: Trading in the middle Bollinger band with one touch options
The middle Bollinger Band has special properties. While it offers a resistance or support level, the market cannot break through. If it does, the bond changes its meaning.
- If the market trades above the middle Bollinger band, the band acts as support. If the market breaks this support, the middle band becomes a resistance. The market was trapped between the upper and middle bands and is now trapped between the middle and lower bands.
- If the market trades below the middle Bollinger band, the band acts as a resistance. If the market breaks through this resistance, the middle band becomes a support. The market was stuck between the lower and middle bands, and is now stuck between the middle and upper bands.
Both events change the entire market environment. If the market breaks through the middle band, it suddenly has enough room to move to the outer band. This means that you know the direction in which the market is likely to move and the distance, which is an excellent basis for trading a high-payout binary option.
Here’s what you do:
- Wait until the market breaks through the middle Bollinger Band.
- If the market breaks through the middle Bollinger Band, invest in a one-test option in the direction of the next Bollinger Band. If the market breaks through the middle Bollinger Band in an upward direction, you invest in a high one-touch option. If the market breaks through the middle Bollinger Band in a downward direction, invest in a low one-test option.
Choosing the right expiration is the most important aspect of this strategy.
- Long expirations move the strike price of your one touch option further away.
- Short expirations keep the strike price of your one touch option close.
For this strategy to make sense, you need to use a one touch option with a strike price within the Bollinger Bands. On the other hand, the expiration should be long enough to give the market enough time to reach the expiration. It takes some experience to find the right mix of closeness and enough time. You can also use momentum indicators such as the average true range (ATR) to provide a mathematical basis for your estimate.
Strategy 3: Trade Foreign Bollinger Bands with Low-Risk Ladder Options
The market is likely to move beyond the outer Bollinger Bands. This knowledge is an excellent basis for trading low-risk learning options.
Ladder options define a number of different strike prices, usually five or six. Some of these prices are higher than the current market price; some are below it; some are near, others are far away. Due to these characteristics, some target prices will be within the Bollinger Bands price channel; some will be outside.
Since the market is unlikely to move outside the Bollinger Bands, it is unlikely to reach target prices that are outside the Bollinger Bands price channel. Ladder options allow you to make this prediction and win a simple trade.
Here’s what you do to execute this strategy:
-
- Set the period of your card to the expiry of your learning option.
- Compare the strike prices of your broker’s learning option with the Bollinger price channel.
- Choose the strike price with the highest payout still outside the Bollinger Bands. Predict that the market may not reach this strike price.
- If the strike price is below the Bollinger Bands, predict that the market will trade above the strike price when your put option expires.
- If the strike price is above the Bollinger Bands, predict that the market will trade below the strike price when your put option expires.
- Repeat the process for all learning option expirations that your broker offers.
To execute this strategy well, make sure the period of your card matches your expiration. Bollinger Bands change with each new period, and a strike price that is outside the range of the Bollinger Bands during the current period may be within their range within the next period.
If you trade a learning option with a one-hour expiration based on a price chart with a 5-minute period, so many things can change before your option expires that the Bollinger Bands become almost meaningless. By matching the period of your card to your expiration, you guarantee that the Bollinger Bands will remain the same until your option expires.
Volume strategy
The volume is one of the most valued indicators. Combined with binary options, a volume strategy can produce excellent results.
What is a volume strategy?
The trading volume is a simple yet important indicator. The volume indicates how many assets traded heavily during a period. The direction of these trades is irrelevant to the volume.
-
-
- A period in which ten stocks traded manually will have a volume of ten, regardless of whether the period contains rising or falling prices.
- A period in which 20 shares were manually traded will have a volume of 20, regardless of whether the period contains rising or falling prices.
-
The trading volume is so important because it helps you interpret market movements:
-
-
- High volume adds meaning. If a period has high volume, many traders have supported the price movements of this period, which means that the market is likely to continue in the same direction.
- Importance of low volume questions. If a period has low volume, few traders have backed the price movements of this period, which means that many traders question the movements of the period and are likely to invest in the opposite direction to take advantage of the wrong movement.
-
As you can see from these examples, the volume only makes sense relative to previous periods. A volume of 300 means nothing until you know whether the preceding periods have higher, lower or similar volume.
A volume strategy uses the volume of each period to create predictions about future price movements:
-
-
- If a period has high volume, a volume strategy predicts that the market will continue to move in the same direction.
- When a period has low volume, a volume strategy predicts that the market will reverse.
- If a period has an average volume, a volume strategy will ignore it.
-
How to execute a volume strategy
Follow these steps to execute a volume strategy with binary options:
-
-
- Check for significant periods. Look for gaps, periods of strong movement, or dojis (periods where the opening and closing price are nearly identical).
- Analyze the volume of these periods. If the trading volume was high during the period, predict that the market will continue in the same direction; if the trading volume was low, predict that the market will return; ignore the period if the volume was average.
- Invest accordingly. Trade rising prices with high options, falling prices with low options, and stagnant prices with ladder options that predict little movement. Keep your expirations short with this strategy. Limit it ideally, to the next period. For example, in a 30-minute price chart, you would use an expiration of 30 minutes.
-
Long-term strategy
Binary options are primarily short-term investments. But if you want to invest for the long term, binary options can also offer you a lot.
How to trade a long term strategy
While binary options are mostly short-term investments with expirations from a few minutes to a few hours, most brokers have also started offering long-term options that allow you to make predictions for the next months and the next year.
These strategies are high/low options with a longer expiration. You predict whether the market will trade higher or lower than the current market price when your option expires.A long-term strategy for binary options should be based on trends. Over the course of a year, long-term trends dominate the market and determine what will happen next. Identify these trends and predict that they will continue. To weaken trends, you can use technical indicators, such as the Money Flow Index (MFI), which help you identify trends that are rising.
Why trading a long-term strategy can be profitable
If you trade a long-term forecast with common assets, you can earn an average of about 10 percent per year. This is a great result, but binary options can do better. Assume that you have found a stock that you are almost certain will trade one year from now. Check out the current price charts from Google, Amazon or Tesla. Such stocks provide the ideal basis for such an investment.
If you predict these stocks will rise with binary options, you can get a payout of about 75 to 90 percent – in one year. Regardless of how well these stocks do, if you buy them directly on the stock market, you will never make a profit that rivals this return.
Now, of course, you have to take risk into account. If you lose your trade – no matter how unlikely you think this event may be – you lose all the money you have invested. Therefore, it is a bad idea to invest all your money in a single trade. Spread your money across multiple stocks, currencies, markets and commodities, and never invest more than 5 percent of your total account balance in a single trade. Also, never invest all your money. With this strategy, you should still be able to make a higher return than you would with stocks, but you reduce your risk.
Straddle Strategy
With digital options, the strategy for strategies is easier and more profitable than with other types of financial assets.
Here’s how you perform it…
What is a simple strategy?
A street strategy follows a simple goal: it wants to make you money regardless of the direction in which the market is moving. With conventional assets, this strategy was difficult to execute. Traders had to buy short and long assets at the same time and hope that the profit from the successful investment outweighs the losses from the unsuccessful one.
For example, with stocks, traders would be a stock and short it at the same time. They will then set stop losses for both trades.
-
-
- If the market moves up, they will lose the short trade and hope that the long investment earns enough money to make up these losses.
- If the market moves down, they will lose the long trade and hope that the short investment earns enough money to make up these losses.
-
With conventional assets, this strategy was a mess. There were fees on each trade that complicated things, and it was impossible to make two investments at the same time. The resulting time lag meant that a battle was never perfect. Finally, the profit from the winning investment was often insufficient to outweigh the losses from the losing trade.
Fortunately, binary options can make the endurance ride simpler and more profitable.
How to Trade the Straddle Strategy
Binaries have taken the law and packaged it into one asset option – limit options. Instead of having to invest in two assets at the same time (which is impossible), the border options allow you to create a right move with a single click. Border options define a price channel around the current market price.
-
-
- If the market exits this price channel, you win your option;
- If the market does not exit the price, you lose your option.
-
Both target prices of the price channel are equidistant from the current market price, meaning you automatically create a perfect holdout. Many binary options brokers offer two types of limit options:
-
-
- One type of border options uses two nearby strike prices and offers a payout of 70 to 75 percent.
- One type of frontier options uses two distant strike prices and offers a payout of up to 300 percent (or higher).
-
Choose the type of limit option that you like best, and you can easily trade strategy by strategy with binary options.
Robot strategy
To execute a binary options strategy well, you need to ban all emotions from your trading and do the same thing over and over again like a robot. Some traders have taken the next logical step and let a robot do all their trading.
Here’s how to execute a robot strategy.
What is a robot strategy?
When trading binary options, you have two basic choices:
1. You trade for yourself,
2. Have someone else trade for you.A robot falls under the second category. Robots are computer programs. These computer programs are trained to execute a trading strategy and invest on behalf of a human trader.
In detail, robots do three things:
1.Robots monitor the market,
2.Robots find profitable trading opportunities, and
3.Robots invest in these opportunities.When you use a robot, you devote your entire trading process to a computer program. You can walk away and literally make money while you sleep.
Why use a robot?
Robots have important advantages compared to human traders:
1. Robots never miss an opportunity. People need sleep and have jobs; robots do not. They can trade all day, which means they can take advantage of every opportunity. With a profitable strategy, more trades means more money, which is ideal for you.
2. Robots don’t make mistakes. People get exhausted; robots do not. They can execute a strategy for years without making a single mistake.
3. Robots can monitor hundreds of assets simultaneously. People can only focus on one thing at a time; robots can focus on millions of things. This is why robots can monitor hundreds of assets. Monitoring more assets leads to more trades, and more trades, with a winning strategy, leads to more money.
Combined, these three advantages can earn you much more money than if you traded for yourself. However, this increases the risk. If a strategy begins to fail, a robot will not be interrupted and allowed time to make adjustments. Performance should also be checked manually.
How can I get a robot?
These ‘bots’ are mostly offered as a service. Read more about specific suppliers on our Robots and Auto Trading page.
Border or range options
An innovative trading style introduced by brokers is ‘border’ trading. Some binary companies may refer to the same trading style as ‘series’ options, but they essentially mean the same thing.
What are border options?
Limit options deal with a range of price levels of an asset. Instead of predicting whether the price of an asset will rise or fall, the traders must predict whether the price of an asset will stay within certain limits (‘limits’) or not.
In limit options, predetermined upper and lower price levels will be specified by your binary options broker. You can choose the expiration date. If you choose a longer expiration period, the range of the asset will expand, ie the upper price level will increase and the lower price level will decrease. As a trader, you have to choose from the two options: ‘In’ or ‘Out’.
Upper and lower range or limit
If you feel that the price level of the asset will remain within the specified limit, you should select ‘In’. On the other hand, if you feel that the price level of the asset will end above the specific price levels, then select ‘Out’. The ‘Off’ option applies to two cases. One where the price is expected to rise higher than the upper price limit, and the other case where the price level is expected to end up less than the lower price limit.
One aspect to be aware of is that brokers can set different upper and lower limits for the ‘in’ and ‘out’ selections. For example, the upper level for the ‘In’ option can be set closer to the current price – for example at 100 where the current price is 90. The upper value when selecting ‘Out’ can be 110. Not all brokers use this extra ‘margin’, but some do; therefore it is worth being aware of. This is a method by which a broker can add to their own margins and protect themselves during particularly volatile periods, or against one-sided trading sentiment.
A percentage figure will be specified by your binary options broker indicating the payout. If your prediction is correct, you will make a profit equal to the predetermined percentage of the amount invested. The profit is credited to your trading balance immediately after the decision of the trade. However, if your prediction turns out to be wrong, you lose the money invested in the trade. The profit percentage depends on the broker and you can find different binary options brokers that offer different payouts for the same asset.
Border trading strategy
By now you should have established that trading limit or range options is based on the volatility of an asset. This is different from the traditional high or low trade, because in that case the upward or downward price movement is important. No binary options signals provider offers border options signals and you have to use your own knowledge and analysis.
If you want to trade frontier options, the first thing to do is to gather information about the asset you want to trade. Suppose you want to trade Apple’s stock via frontier options. First, you should study how the price of the asset has moved over the past few days. You should have a general idea of whether the asset is volatile or stable.
Next, you need to be aware of all the news related to the business. This can drastically improve your win ratio. For example, let’s assume that today Apple launches the next version of its flagship mobile phone. Now if the launch is successful and consumers like it, the share price will rise. If the product doesn’t impress the audience, the stock may take a dive. There is a small chance that the stock prices will remain stable despite such a big event.
This would be an ideal time to trade Apple via border options by selecting the ‘Out’ option. But if you are not aware of the new product launch by the company, you will miss the opportunity to earn money. So it is highly recommended to stay updated with all the news like quarterly report, hierarchy conversion, product launch etc. Which is related to the asset you want to trade.
Strategy for touch / no touch
As the binary options markets have grown, so have the demands and requirements of traders. Experienced clients asked for options that were similar to the traditional Rise / Fall binary options, but could trade with volume and volatility in the market. Brokers were also keen to offer a product that could be traded in both flat and highly volatile markets. From here, the “Touch / No Touch” options were born, allowing limited risk trades on volume and volatility.
Touch options are explained
The ‘binary’ element of the One Touch option remains, as does the limited risk. To be able to complete a “Touch” option; the asset value must touch, or go beyond, the barrier (or ‘target’) level at least once before the expiration of the option .
A “no touch” option represents the opposite – the asset value will not touch the barrier level (or ‘target’) at any point prior to expiration.
In most cases, the handicap level is determined by the broker. However, with certain brokers, the trader can set the barrier. It may be higher than the current asset value, or it may be lower. The distance between the current asset value and the strike price will usually determine the payout structure. These images represent successful Touch and No Touch trades;
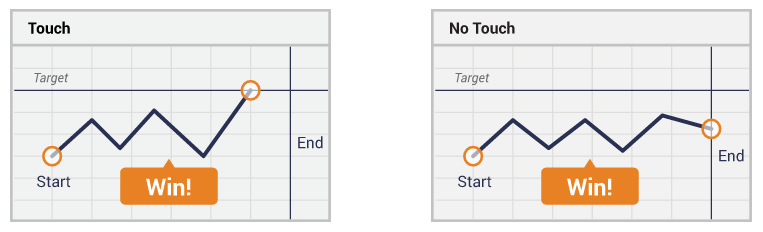
An important difference with the Touch option is that it can end up ‘in the money’ before the expiry time. If the Touch target is met, the option pays out immediately, regardless of what happens to the asset value afterwards.
Broker differences
Traders wishing to use Touch Options should pay particular attention to their choice of trader. First, some brokers don’t offer it at all. Touch options at certain other brokers are not very flexible. Neither are the target levels. However, there are some brokers that offer a great amount of flexibility. Here traders can set their own target levels (payouts adjust accordingly). This provides a tremendous opportunity to use advanced trading techniques. Setting touch options at different intervals to control risks and returns can ensure a trading advantage. Traders can also set targets above and below the current value by creating ‘tunnel’ options.
When to use Touch Options
Advanced traders will be able to successfully use One Touch options throughout their trading day, others may specialize. For example, volume and volatility in the market can be expected to change significantly after a particular data report or event. Similarly, a market can be flat for a period from time to time and with an announcement, and then be volatile. If a trader believes that the trading volume will be particularly low, or particularly high, then the Touch option can allow them to take a position on the view.